- 20 Marks
Question
Boomu Ltd is an agro-processing company with strong competition from Sintim Ltd. The Board of Directors of Boomu Ltd wants to measure the performance of the company against its competitor. Below are the statement of comprehensive income of the two companies for the year ended 31 December 2021, and the statement of financial positions as at that date.
Statement of Comprehensive Income:
| Boomu Ltd (GH¢000) | Sintim Ltd (GH¢000) | |
|---|---|---|
| Revenue | 619,085 | 956,200 |
| Cost of Sales | (424,700) | (762,400) |
| Gross Profit | 194,385 | 193,800 |
| Administrative Expenses | (58,635) | (84,940) |
| Other Income | 6,335 | 9,270 |
| Operating Profit | 142,085 | 118,130 |
| Finance Cost | – | (3,000) |
| Profit Before Income Tax | 142,085 | 115,130 |
| Income Tax Expense | (23,460) | (34,220) |
| Profit for the Year | 118,625 | 80,910 |
Statement of Financial Position:
| Boomu Ltd (GH¢000) | Sintim Ltd (GH¢000) | |
|---|---|---|
| Non-Current Assets | ||
| Property, Plant & Equipment | 231,636 | 197,884 |
| Intangible Assets | 105,320 | 111,928 |
| Total Non-Current Assets | 336,956 | 309,812 |
| Current Assets | ||
| Inventories | 33,960 | 37,480 |
| Trade Receivables | 26,216 | 3,836 |
| Cash and Cash Equivalents | 91,328 | 42,472 |
| Total Current Assets | 151,504 | 83,788 |
| Total Assets | 488,460 | 393,600 |
Equity & Liabilities:
| Boomu Ltd (GH¢000) | Sintim Ltd (GH¢000) | |
|---|---|---|
| Equity | ||
| Share Capital | 20,000 | 30,000 |
| Retained Earnings | 390,536 | 283,820 |
| Total Equity | 410,536 | 313,820 |
| Non-Current Liabilities | ||
| Deferred Taxation | 18,120 | 13,948 |
| 20% Loan Notes | – | 30,000 |
| Total Non-Current Liabilities | 18,120 | 43,948 |
| Current Liabilities | ||
| Trade and Other Payables | 42,904 | 28,040 |
| Current Tax | 16,900 | 7,792 |
| Total Current Liabilities | 59,804 | 35,832 |
| Total Equity & Liabilities | 488,460 | 393,600 |
Required: As the Finance Manager of the company, write a report to the Board of Directors, assessing the comparative performance of the company for the year ended 31 December 2021 using THREE (3) profitability ratios, TWO (2) liquidity ratios, THREE (3) efficiency ratios, and TWO (2) gearing ratios.
Answer
Memorandum
To: The Board of Directors
From: The Finance Manager
Date: 3rd April 2022
Subject: Analysis of the performance of Boomu Ltd
The performance of Boomu Ltd for the year ended 31 December 2021 has been assessed in this report. The performance of Sintim Ltd, a competitor, is used as a benchmark. The ratios used include profitability, working capital management, and gearing.
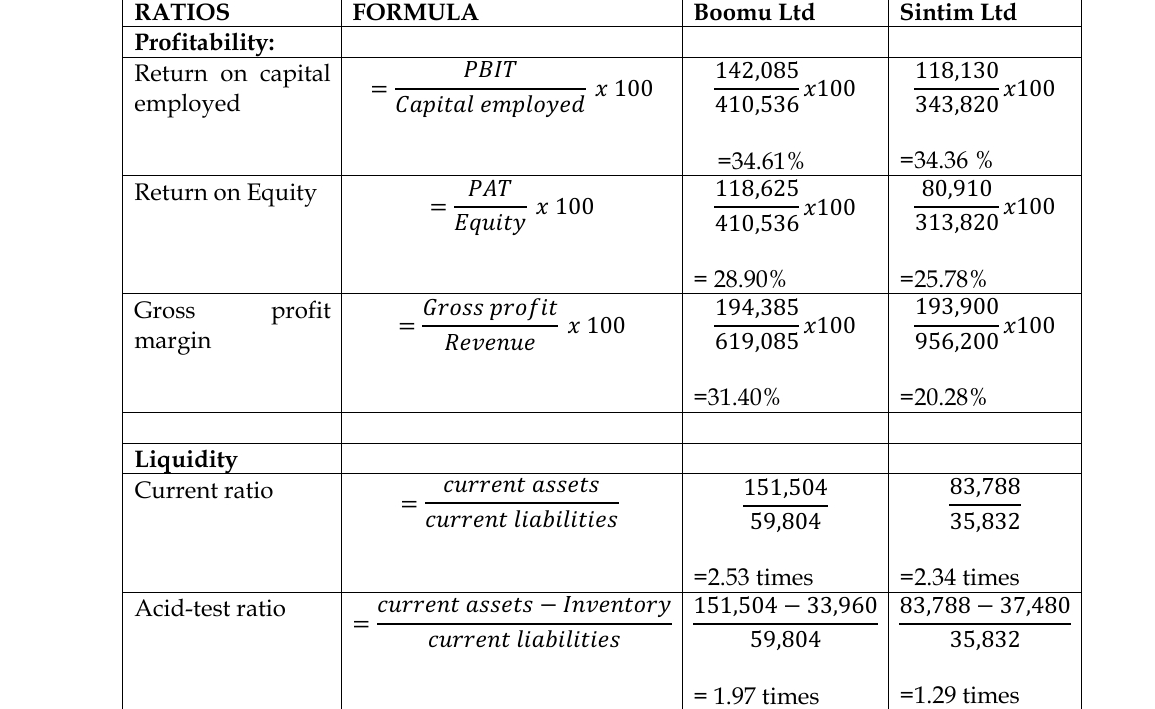
Profitability:
- The revenue of Boomu Ltd was 35.26% lower than that of Sintim Ltd. However, Boomu Ltd generated higher returns for all investors.
- Boomu Ltd’s return on capital employed was 34.61%, while Sintim Ltd had a return of 34.36%.
- Boomu Ltd also generated a higher return on equity (28.90%) compared to Sintim Ltd (25.78%).
- The gross profit margin was higher for Boomu Ltd (31.40%) than Sintim Ltd (20.28%), indicating better control over cost of sales.
Liquidity:
- Boomu Ltd’s current ratio was 2.53 times compared to 2.34 times for Sintim Ltd, suggesting better liquidity.
- The acid-test ratio of Boomu Ltd was 1.97 times, higher than Sintim Ltd’s 1.29 times, indicating that Boomu Ltd had more current assets (excluding inventory) to cover liabilities.
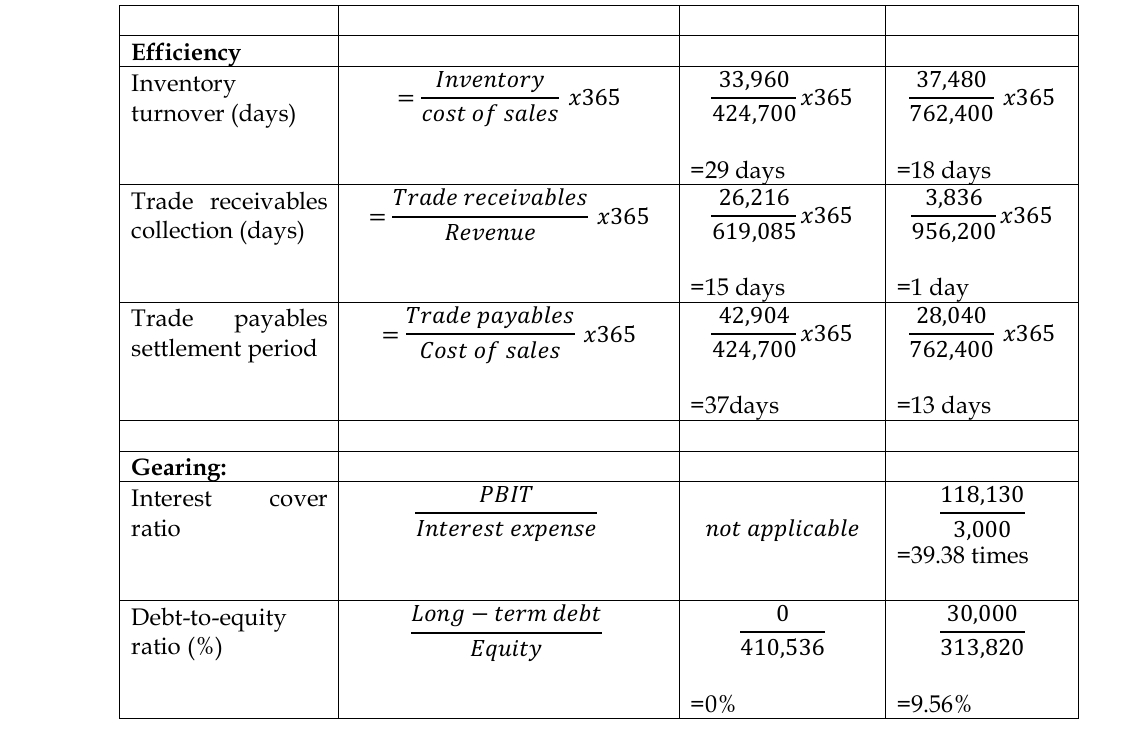
Efficiency:
- Boomu Ltd’s inventory turnover was 29 days, higher than Sintim Ltd’s 18 days, indicating that Sintim Ltd was faster at selling its inventory.
- Boomu Ltd took 15 days to collect receivables, whereas Sintim Ltd took just 1 day, showing superior efficiency in receivables management for Sintim Ltd.
- Boomu Ltd had a trade payables settlement period of 37 days, compared to Sintim Ltd’s 13 days, indicating that Boomu Ltd had better credit terms from suppliers.
Gearing:
- Boomu Ltd is fully equity-financed, meaning no financial risk to shareholders from debt. Sintim Ltd, however, had debt in its capital structure, with a debt-to-equity ratio of 9.56%.
Conclusion: Boomu Ltd performed better than Sintim Ltd in terms of profitability and liquidity but lagged in inventory and receivables management.
Appendix:
(1/4 mark for each correct computation of ratio = 5 marks; 15 marks for the report)
(Total = 20 marks)
- Tags: Competitor Comparison, Efficiency, Financial Performance, Gearing, Liquidity, Profitability, Ratio Analysis
- Level: Level 2
- Topic: Financial Statement Analysis
- Series: MAR 2023
- Uploader: Uploader1