
Question
Answer
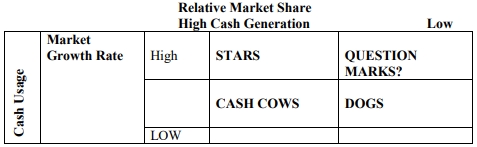
The Boston Consulting Group (BCG) model is a tool for analyzing a business portfolio in terms of:
- Relative Market Share (Cash Generation): Higher market share results in higher cash returns due to benefits from economies of scale and experience curves, leading to higher profits.
- Market Growth Rate (Cash Usage): This is the growth rate of a product in the market relative to others. High growth rates result in higher earnings but consume significant cash. Businesses in high-growth industries are cash users and worth investing in only if expected to maintain or grow their market share.
The categories of products in the BCG Model are:
- Stars:
- High relative market share in a high-growth market
- Market leaders, both cash generators, and users
- Require considerable attention to maintain their position
- Cash Cows:
- High relative market share but low market growth
- Cash generators due to economies of scale
- Profitable brands that should be “milked” for cash to support other products
- Question Marks (Problem Children):
- Low market share in a high-growth market
- Consume a large amount of cash and incur losses
- Require strategic decisions on whether to invest further
- Dogs:
- Low market share in low-growth markets
- Cash drainers, not market leaders
- May generate minimal revenue but are usually not worth significant investment