Question
Answer
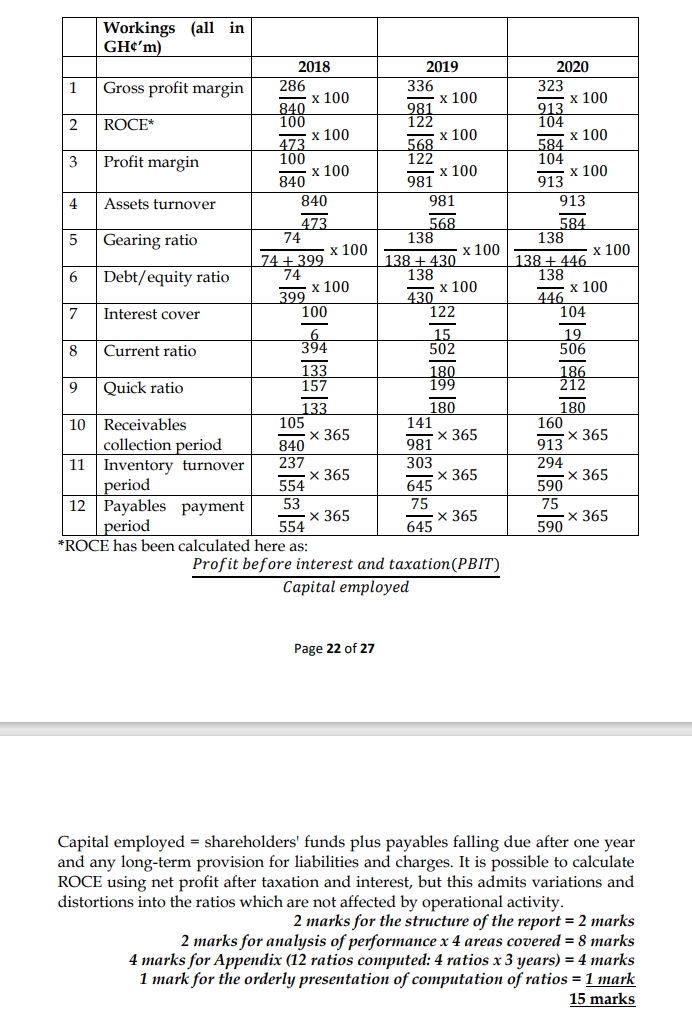
Performance Analysis of Zeus Ltd from 2018 to 2020
Profitability
- The gross profit margin has remained relatively static over the three years, although it rose by approximately 1% in 2018. ROCE, while improving slightly in 2019 to 21.5%, has dropped dramatically in 2020 to 17.8%. The net profit margin has also fallen in 2020, despite the improvement in the gross profit margin. This marks a rise in expenses which suggests that they are not well controlled. The utilisation of assets compared to the turnover generated has also declined, reflecting the drop in trading activity between 2019 and 2020.
Operating Efficiency
- It is apparent that there was a dramatic increase in trading activity between 2019 and 2020, but then a significant fall in 2020. As a result, revenue rose by 17% in 2019 but fell by 7% in 2020. The reasons for this fluctuation are unclear. It may be the effect of some kind of one-off event, or it may be the effect of a change in product mix. Whatever the reason, it appears that improved credit terms granted to customers (receivables payment period up from 46 to 64 days) have not stopped the drop in sales.
Liquidity
- Both the current ratio and quick ratio demonstrate an adequate working capital situation, although the quick ratio showed a slight decline. This is because there has been an increased investment over the period in inventories and receivables, which has been only partly financed by longer payment periods to trade payables and a rise in other payables (mainly between 2019 and 2020).
Solvency
- The level of gearing of the company increased when a further GH¢64 million was raised in long-term loans in 2020 to add to the GH¢74 million already in the statement of financial position. Although this does not seem to be a particularly high level of gearing, the debt/equity ratio rose from 18.5% to 32.0% in 2020. The interest charge has increased to GH¢19 million from GH¢6 million in 2019. The 2020 charge was GH¢15 million, suggesting that either the interest rate on the loan is flexible or that the full interest charge was not incurred in 2020. The new long-term loan appears to have funded the expansion in both fixed and current assets in 2020.
Appendix:
| Ratio | 2018 | 2019 | 2020 |
|---|---|---|---|
| Gross profit margin | 34.0% | 34.30% | 35.40% |
| ROCE | 21.1% | 21.50% | 17.80% |
| Profit margin | 11.9% | 12.40% | 11.40% |
| Assets turnover | 1.78 | 1.73 | 1.56 |
| Gearing ratio | 15.6% | 24.30% | 23.60% |
| Debt/equity ratio | 18.5% | 32.00% | 30.90% |
| Interest cover | 16.7 | 8.1 | 5.5 |
| Current ratio | 3.0 | 2.8 | 2.7 |
| Quick ratio | 1.2 | 1.1 | 1.1 |
| Receivables collection period (days) | 46 | 52 | 64 |
| Inventory turnover period (days) | 156 | 171 | 182 |
| Payables payment period (days) | 35 | 42 | 46 |