
Question
Pat Plc is a listed Ghanaian company that produces textile prints for local and African markets. During the year ended 31 March 2022, the following financial information was available:
Gross profit: GH¢12,150
Cost of sales: GH¢77,850
Operating profit before interest and tax: GH¢7,130
Finance cost: GH¢920
Tax charged to profit or loss: GH¢1,400
Inventory turnover: 3.6 times
Dividend per share: GH¢0.36
Dividend yield: 6%
Extracts from the Statement of Financial Position as at 31 March 2022: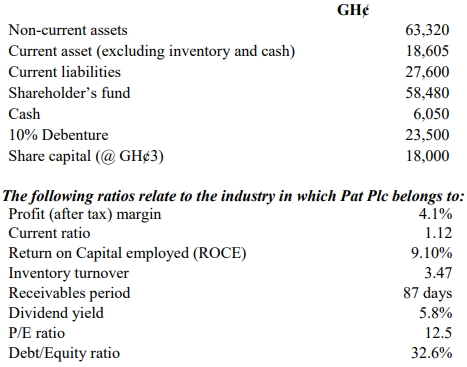
Required:
a. Based on the information provided, compute the following ratios for Pat Plc:
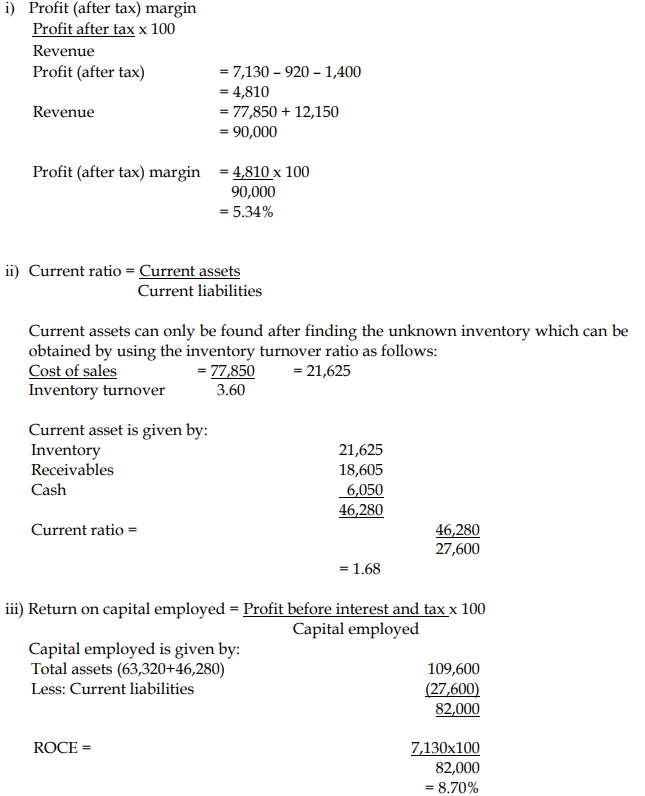
i) Profit (after tax) margin
ii) Current ratio
iii) Return on Capital Employed (ROCE)
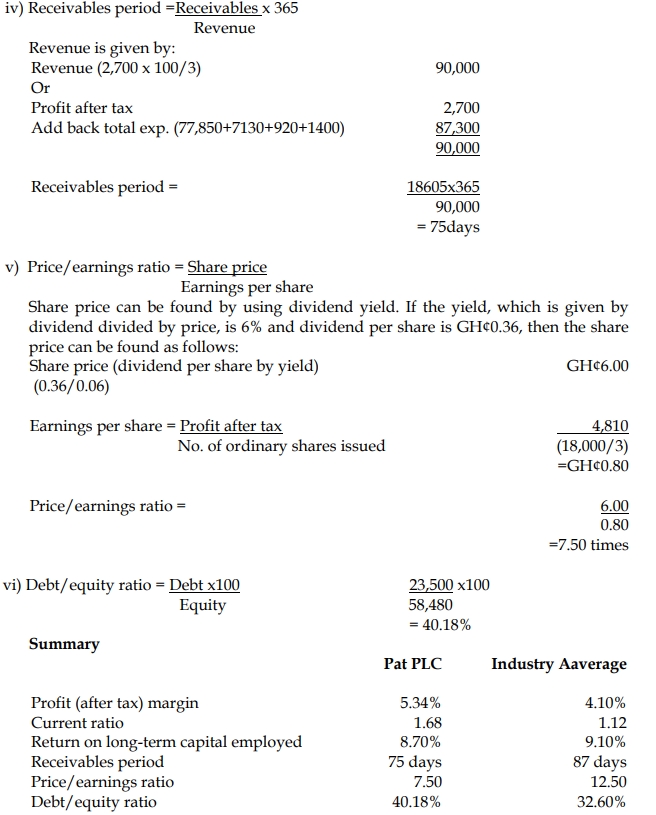
iv) Receivables period
v) Price/Earnings ratio
vi) Debt/Equity ratio
b. Using the ratios computed in Question 4a, write a report to the Board of Directors of Pat Plc assessing the financial performance and financial position of the entity, relative to its industry.
Answer
a. Computation of relevant ratios
b. Report to the Board of Directors of Pat Plc on the Financial Performance and Position
To: Board of Directors, Pat Plc
From: Financial Analyst
Date: August 2022
Subject: Assessment of Financial Performance and Position of Pat Plc
This report provides an assessment of the financial performance and financial position of Pat Plc, comparing the company’s key financial ratios with the industry averages.
Profitability:
The profit after tax margin for Pat Plc is 5.34%, which is higher than the industry average of 4.1%. This suggests that the company is generating better returns on its revenue compared to its competitors. This indicates efficient management of costs and expenses, leading to higher profitability.
However, the Return on Capital Employed (ROCE) for Pat Plc is 8.7%, slightly below the industry average of 9.1%. This indicates that while the company is profitable, it is not utilizing its capital as efficiently as its peers. Improving capital efficiency could lead to better overall returns for the company.
Liquidity:
Pat Plc has a current ratio of 1.68, which is significantly higher than the industry average of 1.12. This indicates that the company is in a strong liquidity position and is better able to meet its short-term obligations compared to other companies in the industry. A higher current ratio suggests that Pat Plc has a sufficient buffer of current assets to cover its current liabilities.
Efficiency:
The receivables period for Pat Plc is 75 days, which is shorter than the industry average of 87 days. This indicates that Pat Plc is more efficient in collecting receivables from its customers than its peers, which improves its cash flow management and reduces the risk of bad debts.
Leverage (Debt/Equity Ratio):
Pat Plc’s debt/equity ratio stands at 40.18%, which is higher than the industry average of 32.6%. This indicates that Pat Plc is more leveraged compared to its peers, exposing the company to higher financial risk due to greater reliance on debt financing. While the company’s debt level is still manageable, it may want to consider reducing its leverage to avoid potential financial distress in the future, especially given its slightly lower ROCE.
Shareholder Performance:
The Price/Earnings (P/E) ratio for Pat Plc is 7.5 times, which is considerably lower than the industry average of 12.5 times. This suggests that the market has a less optimistic view of Pat Plc’s future earnings growth compared to the rest of the industry. While the company is generating decent profits, the low P/E ratio could indicate that investors are not confident in the company’s future growth prospects or are concerned about its higher debt levels.
Additionally, Pat Plc’s dividend yield of 6% is slightly above the industry average of 5.8%, suggesting that the company is providing good returns to its shareholders in the form of dividends. This is a positive signal for investors, although the low P/E ratio indicates that there may be concerns about the company’s long-term growth potential.
Conclusion:
In summary, Pat Plc is performing well in terms of profitability, liquidity, and operational efficiency compared to its industry peers. However, the company’s slightly lower ROCE and higher debt/equity ratio suggest room for improvement in capital utilization and financial risk management. The low P/E ratio also indicates potential concerns from the market about future growth, which the company should address to improve investor confidence.
Signature:
Financial Analyst