Topic: Financial Statement Analysis

Search 500 + past questions and counting.
  • Filter by Professional Bodies

  • Filter by Subject

  • Filter by Series

  • Filter by Topics

  • Filter by Levels

FR – Nov 2024 – L2 – Q4b – Financial Performance Assessment of Acquisition Targets

Assessment of financial performance and position of Suah LTD and Nagbe LTD to assist Dukuly LTD in an acquisition decision.

Dukuly LTD, a public entity, has been expanding through acquisitions. It is assessing two potential acquisition targets, Suah LTD and Nagbe LTD, both operating in the same industry.

The financial statements of Suah LTD and Nagbe LTD for the year ended 30 September 2024 have been provided, along with a set of financial ratios calculated for Suah LTD.

Required:
Using the calculated ratios for Nagbe LTD from Question 4a, assess the relative financial performance and financial position of Suah LTD and Nagbe LTD, to assist the directors of Dukuly LTD in making an acquisition decision.

Login or create a free account to see answers

Find Related Questions by Tags, levels, etc.

Report an error

You're reporting an error for "FR – Nov 2024 – L2 – Q4b – Financial Performance Assessment of Acquisition Targets"

FR – Nov 2024 – L2 – Q4a – Financial Ratios and Performance Evaluation

Calculation of key financial ratios for Nagbe LTD to compare with Suah LTD and evaluate financial performance.

Dukuly LTD, a public entity, has been expanding through acquisitions. It is assessing two potential acquisition targets, Suah LTD and Nagbe LTD, which operate in the same industry. The indicative price for acquiring either entity is GH¢12 million.

The financial statements for Suah LTD and Nagbe LTD are provided as follows:

Statement of Profit or Loss for the year ended 30 September 2024

Item Suah LTD (GH¢’000) Nagbe LTD (GH¢’000)
Revenue 25,000 40,000
Cost of Sales (19,000) (32,800)
Gross Profit 6,000 7,200
Distribution & Admin Expenses (1,250) (2,300)
Finance Costs (250) (900)
Profit Before Tax 4,500 4,000
Income Tax Expense (900) (1,000)
Profit for the Year 3,600 3,000

Statement of Financial Position as at 30 September 2024

Item Suah LTD (GH¢’000) Nagbe LTD (GH¢’000)
Non-Current Assets 4,800 10,300
Current Assets 4,800 8,700
Total Assets 9,600 19,000
Equity 2,600 5,600
Non-Current Liabilities 5,000 9,200
Current Liabilities 2,000 4,200
Total Equity & Liabilities 9,600 19,000

Additional Information:

  1. Carrying Amount of Plant Assets:

    • Suah LTD: GH¢4,800,000
    • Nagbe LTD: GH¢2,000,000
  2. The following ratios for Suah LTD are provided:

    Ratio Suah LTD
    Return on Capital Employed (ROCE) 62.5%
    Net Asset Turnover 3.3 times
    Gross Profit Margin 24.0%
    Profit Margin (Before Interest & Tax) 19.0%
    Current Ratio 2.4:1
    Inventory Holding Period 31 days
    Trade Receivables Collection Period 31 days
    Trade Payables Payment Period 24 days
    Gearing Ratio 65.80%
    Acid Test Ratio 1.6:1

Required:
Using the financial statements provided, calculate the corresponding ratios for Nagbe LTD to compare with Suah LTD.

Login or create a free account to see answers

Find Related Questions by Tags, levels, etc.
Report an error

You're reporting an error for "FR – Nov 2024 – L2 – Q4a – Financial Ratios and Performance Evaluation"

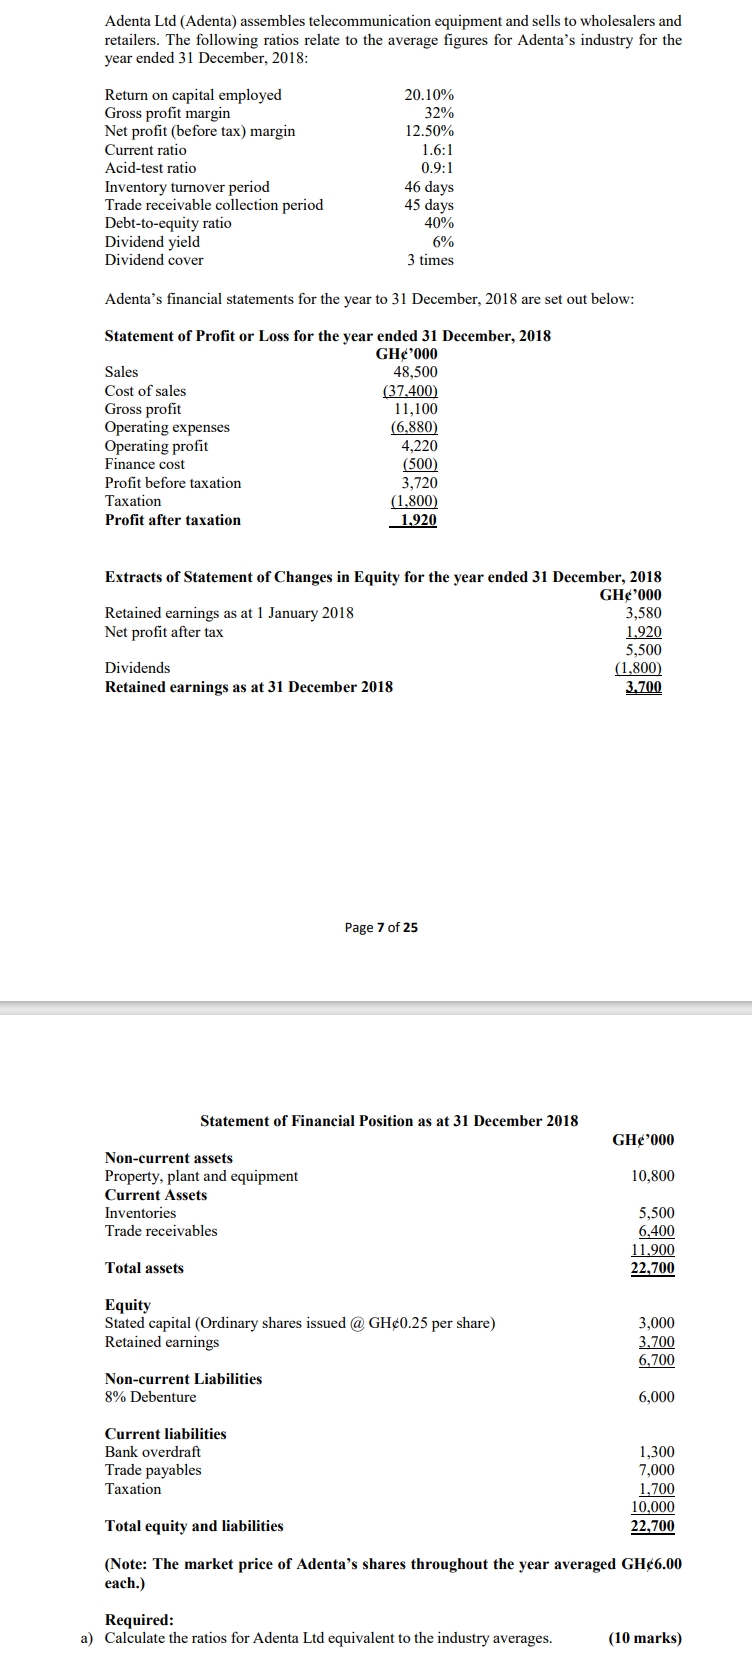
FR – May 2020 – L2 – Q4a – Financial Ratios Calculation

Calculate the financial ratios of Adenta Ltd for the year ended 31 December 2018 based on its financial statements.

Login or create a free account to see answers

Find Related Questions by Tags, levels, etc.
Report an error

You're reporting an error for "FR – May 2020 – L2 – Q4a – Financial Ratios Calculation"

FR – May 2020 – L2 – Q4b – Financial Performance Analysis

Write a report analyzing Adenta Ltd's financial performance in comparison to industry averages for 2018.

As the Financial Controller of Adenta Ltd, write a report to the Board of Directors analyzing the financial performance of Adenta Ltd based on a comparison with the industry averages. (10 marks)


Login or create a free account to see answers

Find Related Questions by Tags, levels, etc.
Report an error

You're reporting an error for "FR – May 2020 – L2 – Q4b – Financial Performance Analysis"

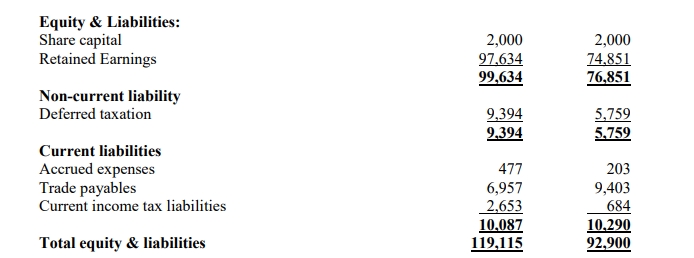
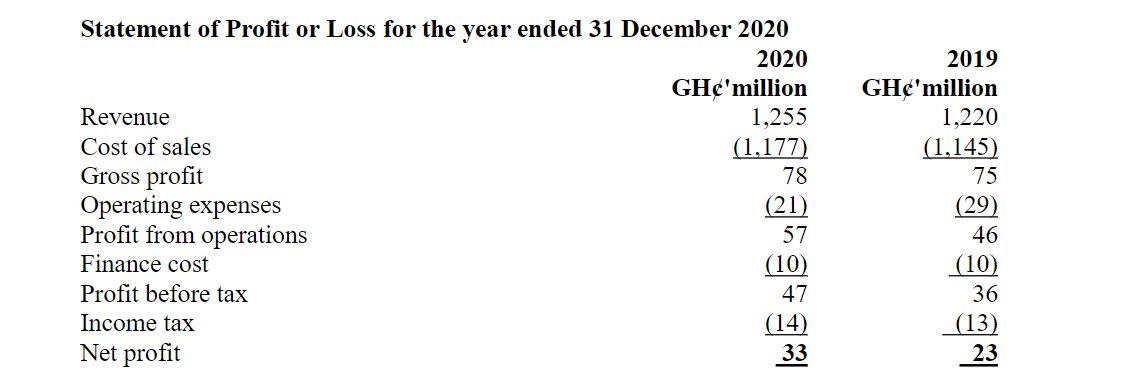
FR – Dec 2022 – L2 – Q4 – Financial Analysis & Ratios

Analyze and compare Madina Ltd.’s performance using key financial ratios for the years 2020 and 2021, including comparisons with industry standards.

Madina Ltd is engaged in the processing of palm fruits to produce palm oil and palm kernel oil. The financial statements of the company for the years ended 31st December 2020 and 2021 are as follows:

Statement of Profit or Loss for the year ended

Description 2021 (GH¢’000) 2020 (GH¢’000)
Revenue 123,817 95,620
Cost of sales (84,940) (76,240)
Net gains from changes in fair value of biological assets 84 754
Gross profit 38,961 20,134
Administrative expenses (11,727) (8,494)
Other income 1,267 927
Operating profit 28,501 12,567
Finance income 888 508
Profit before income tax 29,389 13,075
Income tax expense (4,692) (3,422)
Profit for the year 24,697 9,653

Statement of Financial Position as at:

Description 2021 (GH¢’000) 2020 (GH¢’000)
Non-current assets
Property, Plant & Equipment 57,909 49,471
Financial assets 5,221 5,137
Current assets
Inventories 8,490 9,370
Trade Receivables 24,663 18,304
Cash and cash equivalents 22,832 10,618
Total Assets 119,115 92,900

The following ratios have been gathered from the food and processing industry for the year ended 31 December 2021:

  • Return on Equity (%) 23.52
  • Gross Profit Margin (%) 29.57
  • Net Profit Margin (%) 22.16
  • Current Ratio (times) 2.5
  • Acid Test Ratio (times) 1.8
  • Inventory Turnover (days) 20
  • Trade Receivables Collection (days) 68
  • Trade Payables Settlement (days) 32

Required:
Write a report to the Board of Directors of Madina Ltd, assessing the company’s performance for the year ended 31 December 2021 in relation to the industry and the comparative year.

Login or create a free account to see answers

Find Related Questions by Tags, levels, etc.

Report an error

You're reporting an error for "FR – Dec 2022 – L2 – Q4 – Financial Analysis & Ratios"

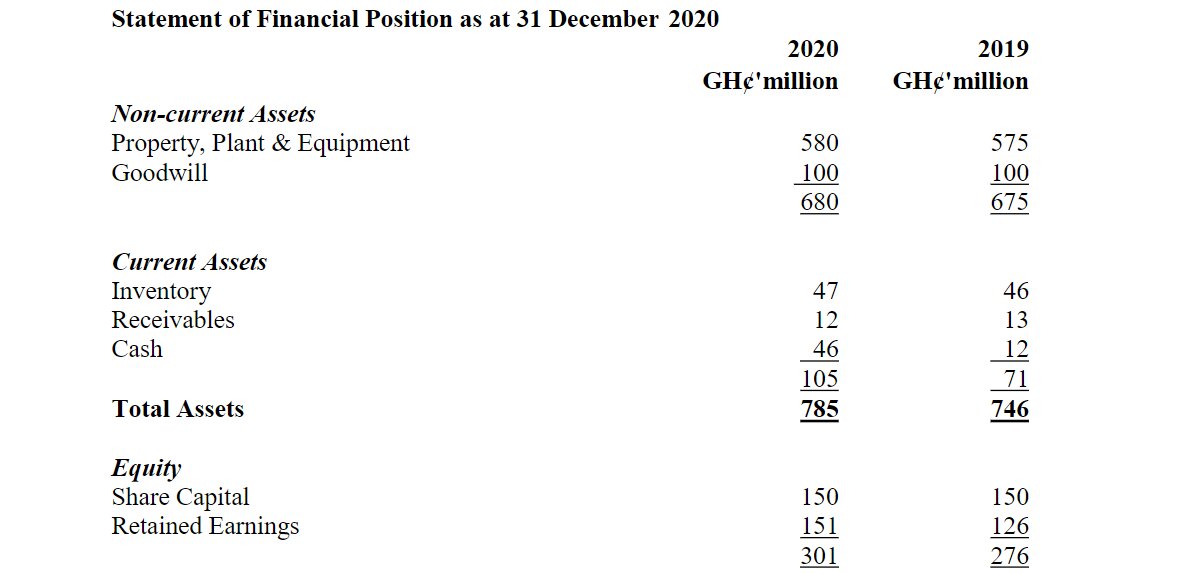
FR – MAY 2021 – L2 – Q4a – Performance Analysis

Analyze Zeus Ltd's performance and position from 2018 to 2020, including calculations.

You are the Financial Controller of Konka Ltd. Zeus Ltd is a competitor in the same industry, and it has been operating for 20 years. Summaries of Zeus Ltd’s statements of profit or loss and financial position for the previous three years are given below.

Summarised Statement of Profit or Loss For the year ended 31 December

2018 2019 2020
Revenue 840 981 913
Cost of sales (554) (645) (590)
Gross profit 286 336 323
Administration and selling expenses (186) (214) (219)
Profit before interest and taxes 100 122 104
Finance cost (6) (15) (19)
Profit before taxation 94 107 85
Taxation (45) (52) (45)
Profit after taxation 49 55 40
Dividends 24 24 24

Summarised Statement of Financial Position as at 31 December

2018 2019 2020
Assets
Non-current assets
Intangible assets 36 40 48
Tangible assets at net book value 176 206 216
Total Non-current assets 212 246 264
Current assets
Inventories 237 303 294
Receivables 105 141 160
Bank 52 58 52
Total Current Assets 394 502 506
Total Assets 606 748 770
Equity and Liabilities
Equity
Stated capital 100 100 100
Retained earnings 299 330 346
Total Equity 399 430 446
Non-current liabilities
Long-term loans 74 138 138
Current liabilities
Trade payables 53 75 75
Other payables 80 105 111
Total Current Liabilities 133 180 186
Total Equity and Liabilities 606 748 770

Required:
a) Analyzing the performance and position of Zeus Ltd and showing any calculations in an appendix to this report.
(15 marks)


Login or create a free account to see answers

Find Related Questions by Tags, levels, etc.
Report an error

You're reporting an error for "FR – MAY 2021 – L2 – Q4a – Performance Analysis"

FR – MAY 2021 – L2 – Q4b – Areas Requiring Further Investigation

Identify five areas needing further investigation regarding Zeus Ltd's performance.

Summarising FIVE (5) areas that require further investigation, including reference to other pieces of information which would complement your analysis of the performance of Zeus Ltd.

Login or create a free account to see answers

Find Related Questions by Tags, levels, etc.

Report an error

You're reporting an error for "FR – MAY 2021 – L2 – Q4b – Areas Requiring Further Investigation"

FR – March 2023 – L2 – Q4 – Financial Statement Analysis

Analyze and compare the financial performance of Boomu Ltd and Sintim Ltd using profitability, liquidity, efficiency, and gearing ratios.

Boomu Ltd is an agro-processing company with strong competition from Sintim Ltd. The Board of Directors of Boomu Ltd wants to measure the performance of the company against its competitor. Below are the statement of comprehensive income of the two companies for the year ended 31 December 2021, and the statement of financial positions as at that date.

Statement of Comprehensive Income:

Boomu Ltd (GH¢000) Sintim Ltd (GH¢000)
Revenue 619,085 956,200
Cost of Sales (424,700) (762,400)
Gross Profit 194,385 193,800
Administrative Expenses (58,635) (84,940)
Other Income 6,335 9,270
Operating Profit 142,085 118,130
Finance Cost (3,000)
Profit Before Income Tax 142,085 115,130
Income Tax Expense (23,460) (34,220)
Profit for the Year 118,625 80,910

Statement of Financial Position:

Boomu Ltd (GH¢000) Sintim Ltd (GH¢000)
Non-Current Assets
Property, Plant & Equipment 231,636 197,884
Intangible Assets 105,320 111,928
Total Non-Current Assets 336,956 309,812
Current Assets
Inventories 33,960 37,480
Trade Receivables 26,216 3,836
Cash and Cash Equivalents 91,328 42,472
Total Current Assets 151,504 83,788
Total Assets 488,460 393,600

Equity & Liabilities:

Boomu Ltd (GH¢000) Sintim Ltd (GH¢000)
Equity
Share Capital 20,000 30,000
Retained Earnings 390,536 283,820
Total Equity 410,536 313,820
Non-Current Liabilities
Deferred Taxation 18,120 13,948
20% Loan Notes 30,000
Total Non-Current Liabilities 18,120 43,948
Current Liabilities
Trade and Other Payables 42,904 28,040
Current Tax 16,900 7,792
Total Current Liabilities 59,804 35,832
Total Equity & Liabilities 488,460 393,600

Required: As the Finance Manager of the company, write a report to the Board of Directors, assessing the comparative performance of the company for the year ended 31 December 2021 using THREE (3) profitability ratios, TWO (2) liquidity ratios, THREE (3) efficiency ratios, and TWO (2) gearing ratios.

Login or create a free account to see answers

Find Related Questions by Tags, levels, etc.
Report an error

You're reporting an error for "FR – March 2023 – L2 – Q4 – Financial Statement Analysis"

FR – April 2022 – L2 – Q4 – Financial Statement Analysis

Analyze the performance and position of Abayie Ltd based on its financial statements, comparing it with key sector ratios, and prepare a report for shareholders.

Abayie Ltd is a listed company in Ghana and operates many supermarkets in Ghana. The following statements relate to Abayie Ltd for the year 2020:

Statement of Profit or Loss for the year ended 31 December 2020


Additional Information:
Key ratios for the supermarket sector (based on the latest available financial statement of 12 listed entities in the sector) are as follows:

  • Gross Profit margin: 5.9%
  • Return on Capital Employed (ROCE): 3.9%
  • Net Assets Turnover: 1.93 times

Required:
Prepare a report addressed to the shareholders of Abayie Ltd, analyzing the performance and position of Abayie Ltd based on the financial statements and additional information provided. The report should also include comparisons with key sector ratios (where appropriate). (Total: 20 marks)

Login or create a free account to see answers

Find Related Questions by Tags, levels, etc.
Report an error

You're reporting an error for "FR – April 2022 – L2 – Q4 – Financial Statement Analysis"

FR – Nov 2023 – L2 – Q4a – Financial Statement Analysis

Calculate key financial ratios for Addin Petroleum and Gyan Petroleum to assess their performance for acquisition purposes.

You are the Chief Finance Officer of LizOil Co. Ltd, a holding company with subsidiaries that have diversified interests. The company’s Board of Directors are interested in acquiring a new subsidiary in the Downstream Petroleum Sector. Two companies have been identified as potentials for the acquisitions: Addin Petroleum and Gyan Petroleum. The following are the summaries of their respective financial statements:

Statement of Profit or Loss for the year ended 30 September 2022

Statement of Financial Position as at 30 September 2022

Required:
a) Calculate the following ratios for each of the two companies: i) Net profit margin ii) Return on year-end capital employed iii) Quick ratio iv) Trade receivables’ collection period (in days) v) Gearing (debt over debt plus equity) vi) Interest cover (9 marks)

b) Write a report to the Chairperson of the board based on a comparable analysis of performance of both companies using the ratios computed in (a) above. (9 marks)
c) State TWO (2) limitations of ratios. (2 marks)

Login or create a free account to see answers

Find Related Questions by Tags, levels, etc.
Report an error

You're reporting an error for "FR – Nov 2023 – L2 – Q4a – Financial Statement Analysis"

FR – Nov 2018 – L2 – Q4 – Financial Statement Analysis

Assess the financial performance and position of Light Ltd and Favour Ltd for acquisition purposes based on profitability, liquidity, and gearing ratios.

Salt Ltd is a Government Business Entity that would like to acquire 100% of a viable private company. It has obtained the following draft financial statements for two companies, Light Ltd and Favour Ltd. They operate in the same industry, and their managements have indicated they would be receptive to a takeover.

Statement of Profit or Loss for the year ended 31 December 2017:

Description Light Ltd (GH¢’000) Favour Ltd (GH¢’000)
Revenue 12,000 20,500
Cost of sales (10,500) (18,000)
Gross profit 1,500 2,500
Operating expenses (240) (500)
Finance costs (210) (600)
Profit before tax 1,050 1,400
Income tax expense (150) (400)
Profit for the year 900 1,000
Dividends paid 250 700

Statements of Financial Position as at 31 December 2017:

Description Light Ltd (GH¢’000) Favour Ltd (GH¢’000)
Assets
Non-current assets:
Freehold factory 4,400
Owned plant 5,000 2,200
Leased plant 5,300
Total non-current assets 9,400 7,500
Current assets:
Inventory 2,000 3,600
Trade receivables 2,400 3,700
Bank 600
Total current assets 5,000 7,300
Total assets 14,400 14,800
Equity and Liabilities
Equity shares of GH¢1 each 2,000 2,000
Property revaluation reserve 900
Retained earnings 2,600 800
Total equity 5,500 2,800
Non-current liabilities
Finance lease obligations 3,200
7% loan notes 3,000
10% loan notes 3,000
Deferred tax 600 100
Government grants 1,200
Total non-current liabilities 4,800 6,300
Current liabilities
Bank overdraft 1,200
Trade payables 3,100 3,800
Government grants 400
Finance lease obligations 500
Taxation 600 200
Total current liabilities 4,100 5,700
Total equity and liabilities 14,400 14,800

Notes:

i. Both companies operate from the same premises.
ii. Additional details of the two companies’ plant are:

Description Light Ltd (GH¢’000) Favour Ltd (GH¢’000)
Owned plant – Historical cost 8,000 10,000
Leased plant – Original fair value 7,500

There were no disposals of plant during the year by either company.

iii. The interest rate implicit within Favour Ltd’s finance leases is 7.5% per annum. For the purpose of calculating ROCE and gearing, all finance lease obligations are treated as long-term interest-bearing borrowings.

Required:
Assess the relative financial performance and financial position of Light Ltd and Favour Ltd for the year ended 31 December 2017 to inform the directors of Salt Ltd in their acquisition decision. Your analysis should focus on profitability, liquidity, and gearing.
(15 marks)

Login or create a free account to see answers

Find Related Questions by Tags, levels, etc.
Report an error

You're reporting an error for "FR – Nov 2018 – L2 – Q4 – Financial Statement Analysis"

FR – Nov 2018 – L2 – Q3b – Financial Statement Analysis

Explanation of four benefits of cash flow information to users of financial statements.

An entity shall prepare a statement of cash flows in accordance with the requirements of IAS 7: Statement of Cash Flows and shall present it as an integral part of its financial statements for each period for which financial statements are presented.

Required:
Explain FOUR (4) benefits of cash flow information to users of financial statements.
(4 marks)

Login or create a free account to see answers

Find Related Questions by Tags, levels, etc.
Report an error

You're reporting an error for "FR – Nov 2018 – L2 – Q3b – Financial Statement Analysis"

FR – Aug 2022 – L2 – Q4 – Financial Statement Analysis

Calculate various financial ratios for Pat Plc and compare them to industry averages and Write a report to assess the financial performance and position of Pat Plc relative to industry standards based on the calculated ratios.

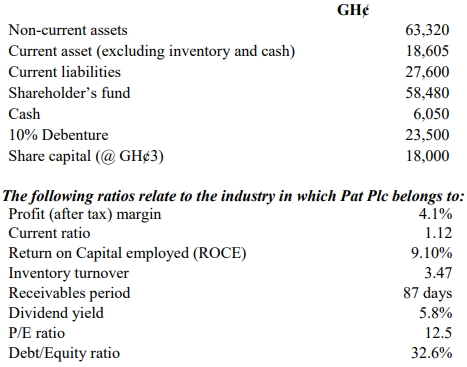
Pat Plc is a listed Ghanaian company that produces textile prints for local and African markets. During the year ended 31 March 2022, the following financial information was available:

Gross profit: GH¢12,150
Cost of sales: GH¢77,850
Operating profit before interest and tax: GH¢7,130
Finance cost: GH¢920
Tax charged to profit or loss: GH¢1,400
Inventory turnover: 3.6 times
Dividend per share: GH¢0.36
Dividend yield: 6%

Extracts from the Statement of Financial Position as at 31 March 2022:

Required:
a. Based on the information provided, compute the following ratios for Pat Plc:
i) Profit (after tax) margin
ii) Current ratio
iii) Return on Capital Employed (ROCE)
iv) Receivables period
v) Price/Earnings ratio
vi) Debt/Equity ratio

b. Using the ratios computed in Question 4a, write a report to the Board of Directors of Pat Plc assessing the financial performance and financial position of the entity, relative to its industry.

Login or create a free account to see answers

Find Related Questions by Tags, levels, etc.

Report an error

You're reporting an error for "FR – Aug 2022 – L2 – Q4 – Financial Statement Analysis"

FR – May 2019 – L2 – Q4a – Financial Statement Analysis

Calculation of various financial ratios based on the financial statements of Zangi Ltd for 2017 and 2018.

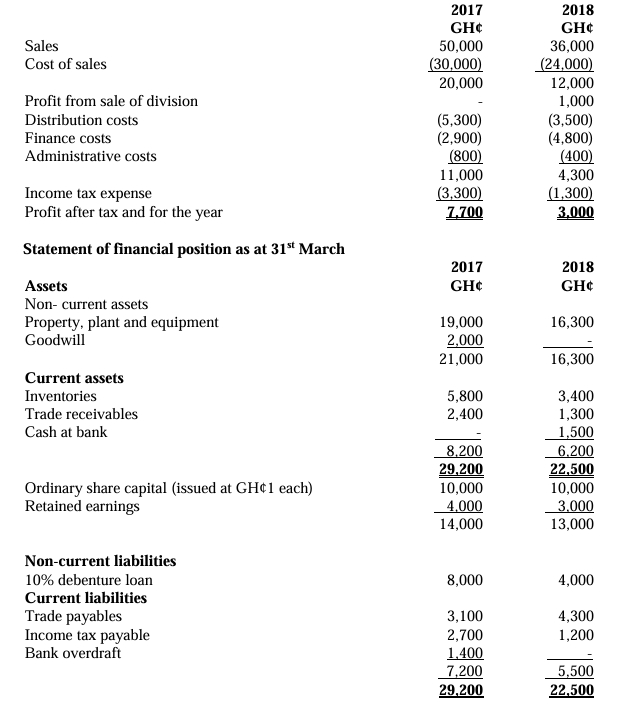
Zangi Ltd is a private company in Ghana, and extracts from its most recent financial statements are provided below:

Statement of profit or loss for the year ended 31 March:

Required:

a) Calculate the following ratios using the information in the financial statements above:

  • i) Operating profit margin
  • ii) Gross profit margin
  • iii) Return on assets employed
  • iv) Debt to equity
  • v) Interest cover
  • vi) Current ratio
  • vii) Quick ratio

b) Comment on the profitability, liquidity, and gearing of the company for the two-year periods based on the ratios computed above and advice management where appropriate.

Login or create a free account to see answers

Find Related Questions by Tags, levels, etc.

Report an error

You're reporting an error for "FR – May 2019 – L2 – Q4a – Financial Statement Analysis"

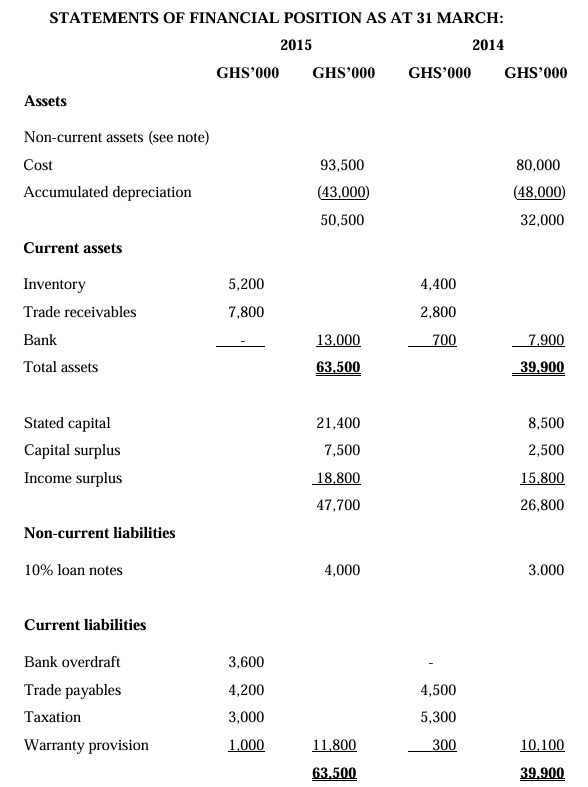
FR – Nov 2015 – L2 – Q3 – Preparation of Financial Statements, Financial Statement Analysis

This question requires preparing a cash flow statement for CL Ltd using IAS 7 and calculating the gross profit margin based on changes in purchase and selling prices.

(a) CL Ltd is a wholesaler and retailer of office furniture. Extracts from the company’s financial statements are set out below:

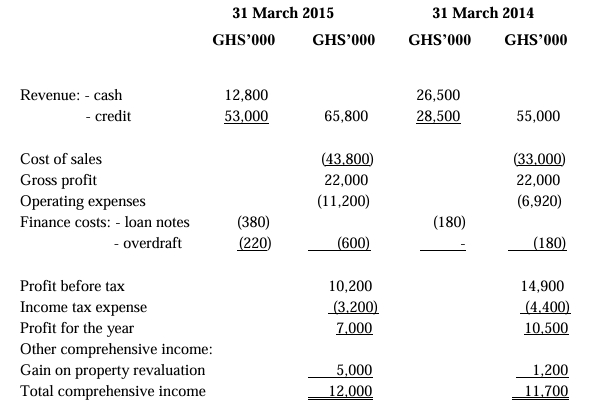
STATEMENT OF PROFIT OR LOSS AND OTHER COMPREHENSIVE INCOME
FOR THE YEAR ENDED:

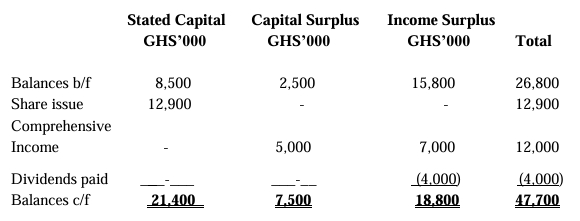
STATEMENT OF CHANGES IN EQUITY
FOR THE YEAR ENDED 31 MARCH 2015:

Description Stated Capital Capital Surplus Income Surplus Total
Balances b/f 8,500 2,500 15,800 26,800
Share issue 12,900 12,900
Comprehensive income 5,000 7,000 12,000
Dividends paid (4,000) (4,000)
Balances c/f 21,400 7,500 18,800 47,700

STATEMENT OF FINANCIAL POSITION
AS AT 31 MARCH:

Note:
Non-current assets
During the year, the company redesigned its display areas in all of its outlets. The previous displays had cost GHS10 million and had been written down by GHS9 million. There was an unexpected cost of GHS500,000 for the removal and disposal of the old display areas. Also, during the year, the company revalued the carrying amount of its property upwards by GHS5 million, and the accumulated depreciation on these properties of GHS2 million was reset to zero.
All depreciation is charged to operating expenses.

Required:
Prepare a statement of cash flows for CL Ltd for the year ended 31 March 2015 in accordance with IAS 7 – Statement of Cash Flows. (15 marks)

(b) The directors of CL Ltd are concerned at the deterioration in its bank balance and are surprised that the amount of gross profit has not increased for the year ended 31 March 2015. At the beginning of the current accounting period (i.e. on 1 April 2014), the company changed to importing its purchases from a foreign supplier because the trade prices quoted by the new supplier were consistently 10% below those of its previous supplier. However, the new supplier offered a shorter period of credit than the previous supplier (all purchases are on credit). In order to encourage higher sales, CL Ltd increased its credit period to its customers, and some of the cost savings (on trade purchases) were passed on to customers by reducing selling prices on both cash and credit sales by 5% across all products.

Required:
(i) Calculate the gross profit margin that you would have expected CL Ltd to achieve for the year ended 31 March 2015 based on the selling and purchase price changes described by the directors. (2 marks)

(ii) Comment on the directors’ surprise at the unchanged gross profit and suggest what other factors may have affected gross profit for the year ended 31 March 2015.

(3 marks)
(Total: 20 marks)

Login or create a free account to see answers

Find Related Questions by Tags, levels, etc.

Report an error

You're reporting an error for "FR – Nov 2015 – L2 – Q3 – Preparation of Financial Statements, Financial Statement Analysis"

FR – Nov 2015 – L2 – Q2 – Financial Statement Analysis

This question requires calculating financial ratios and analyzing Kack Ltd's financial performance and position for the year ended 31 March 2015 compared to the previous year.

Kack Ltd is a listed company that assembles domestic electrical goods which it then sells to both wholesale and retail customers. Kack Ltd’s management was disappointed in the company’s results for the year ended 31 March 2014. In an attempt to improve performance, the following measures were taken early in the year ended 31 March 2015:

  • A national advertising campaign was undertaken.
  • Rebates to all wholesale customers purchasing goods above set quantity levels were introduced.
  • The assembly of certain lines ceased and was replaced by bought-in completed products. This allowed Kack Ltd to dispose of surplus plant.

Kack Ltd’s summarised financial statements for the year ended 31 March 2015 are set out below:

STATEMENT OF PROFIT OR LOSS AND OTHER COMPREHENSIVE INCOME
FOR THE YEAR ENDED 31 MARCH 2015

Description GHSm
Revenue (25% cash sales) 4,000
Cost of sales (3,450)
Gross profit 550
Operating expenses (370)
Operating profit 180
Profit on disposal of plant (note (i)) 40
Financial charges (20)
Profit before tax 200
Income tax expense (50)
Profit for the year 150

STATEMENT OF FINANCIAL POSITION
AS AT 31 MARCH 2015

Description GHSm GHSm
Non-current assets
Property, plant, and equipment (note (ii)) 550
Current assets
Inventory 250
Trade receivables 360
Bank nil
Total current assets 610
Total assets 1,160
Equity and liabilities
Equity
Stated capital (400m shares) 100
Income surplus 380
Total equity 480
Non-current liabilities
8% loan notes 200
Current liabilities
Bank overdraft 10
Trade payables 430
Current tax payables 40
Total current liabilities 480
Total equity and liabilities 1,160

Below are ratios calculated for the year ended 31 March 2014:

  • Return on year-end capital employed (profit before interest and tax over total assets less current liabilities): 28.1%
  • Net assets (equal to capital employed) turnover: 4 times
  • Gross profit margin: 17%
  • Net profit (before tax) margin: 6.3%
  • Current ratio: 1.6:1
  • Closing inventory holding period: 46 days
  • Trade receivables’ collection period: 45 days
  • Trade payables’ payment period: 55 days
  • Dividend yield: 3.75%
  • Dividend cover: 2 times

Notes:

  1. Kack Ltd received GHS 120 million from the sale of plant that had a carrying amount of GHS 80 million at the date of its sale.
  2. The market price of Kack Ltd’s share throughout the year averaged GHS 3.75 each.
  3. There were no issues or redemption of shares or loans during the year.
  4. Dividends paid during the year ended 31 March 2015 amounted to GHS 90 million, maintaining the same dividend paid in the year ended 31 March 2014.

Required:

a) Calculate ratios for the year ended 31 March 2015 (showing your workings) for Kack Ltd, equivalent to those provided above.
(10 marks)

b) Analyse the financial performance and position of Kack Ltd for the year ended 31 March 2015 compared to the previous year.
(10 marks)
(Total: 20 marks)

Login or create a free account to see answers

Find Related Questions by Tags, levels, etc.

Report an error

You're reporting an error for "FR – Nov 2015 – L2 – Q2 – Financial Statement Analysis"

Oops!

This feature is only available in selected plans.

Click on the login button below to login if you’re already subscribed to a plan or click on the upgrade button below to upgrade your current plan.

If you’re not subscribed to a plan, click on the button below to choose a plan