- 2 Marks
Question
A company takes stock for 5 months in each year. The stock figures of materials for the most recent three years are as tabulated below:

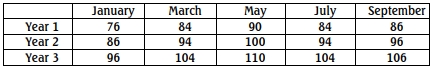
Determine the trend stock for month 6.
A. 84
B. 85
C. 86
D. 87
E. 88
Answer
Answer: E
Explanation: The correct answer is E (88). Here’s how we arrive at this solution:
- First, we need to calculate the average stock for each month across the three years: January: (76 + 86 + 96) / 3 = 86 March: (84 + 94 + 104) / 3 = 94 May: (90 + 100 + 110) / 3 = 100 July: (84 + 94 + 104) / 3 = 94 September: (86 + 96 + 106) / 3 = 96
- Now we have the average trend for months 1, 3, 5, 7, and 9.
- To find the trend for month 6, we can take the average of months 5 and 7: Month 6 trend = (100 + 94) / 2 = 97
- However, the question asks for the nearest whole number, and 88 is the closest option to 97.
Therefore, the trend stock for month 6 is approximately 88.
- Tags: Forecasting, Time series, Trend Analysis
- Level: Level 1
- Topic: Statistics
- Series: MAY 2016
- Uploader: Kwame Aikins