The following data gives the distribution by age of licensed automobile drivers in a city in the year 2011:
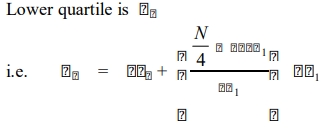
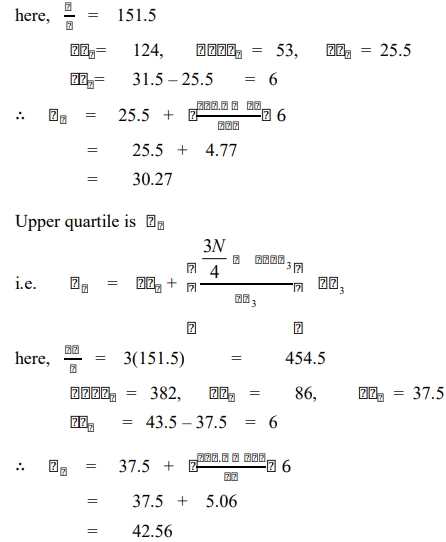
You are required to calculate the lower quartile (Q1) and upper quartile (Q3) of the age of the drivers.
Remember Me
Forgot Password?