
- 20 Marks
Question
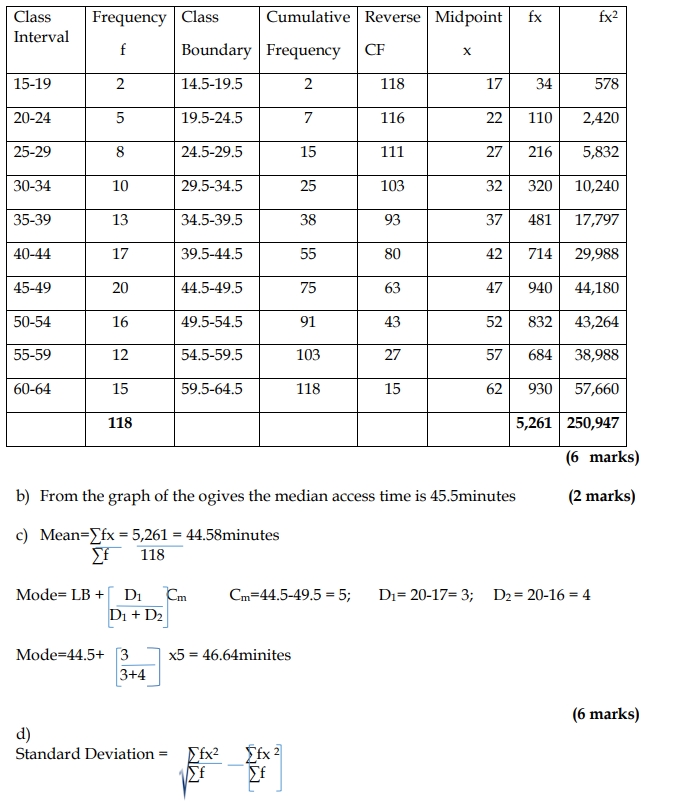
Data on access time, in minutes, to a medical consultant who charges by the hour was recorded by his accountant’s assistant over a period of one week. Using a class width of 4 minutes, the following frequency distribution table was obtained:
| Access Time (Minutes) | Number of Patients |
|---|---|
| 15 – 19 | 2 |
| 20 – 24 | 5 |
| 25 – 29 | 8 |
| 30 – 34 | 10 |
| 35 – 39 | 13 |
| 40 – 44 | 17 |
| 45 – 49 | 20 |
| 50 – 54 | 16 |
| 55 – 59 | 12 |
| 60 – 64 | 15 |
Required:
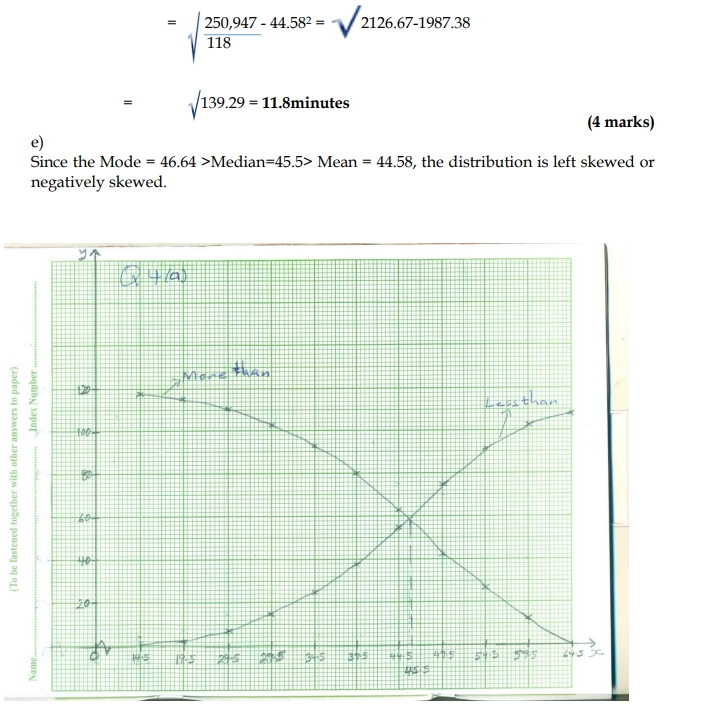
a) Using a graph sheet, draw a less than or a greater than (more than) cumulative frequency curve (ogive) of the data. (6 marks)
b) From the ogive in (a) above, estimate the median access time. (2 marks)
c) Calculate the mean and the mode of the access times. (6 marks)
d) Calculate the standard deviation of the distribution. (4 marks)
e) Using the values in (b) and (c) above, comment on the skewness of the distribution. (2 marks)
(Total: 20 marks)
Answer
a)
- Tags: Frequency Distribution, Mean, Median, Mode, Ogive, Skewness, Standard Deviation
- Level: Level 1
- Topic: Data Collection, Measures of Central Tendency, Measures of Dispersion
- Series: NOV 2017
- Uploader: Theophilus