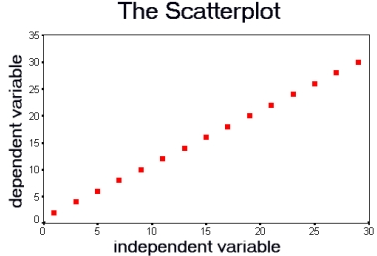
- 2 Marks
Question
Sketch a scatter graph for two variables (dependent and independent variables) that represents:
i) Perfect positive correlation between the variables. (1 mark)
ii) Perfect negative correlation between the variables. (1 mark)
Answer
a)
i. Perfect positive correlation

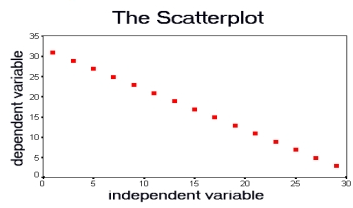
ii. . Perfect negative correlation

- Tags: Correlation, Negative Correlation, Positive Correlation, Scatter Plot
- Level: Level 1
- Topic: Forecasting
- Series: MAY 2018
- Uploader: Kwame Aikins