
Question
Answer
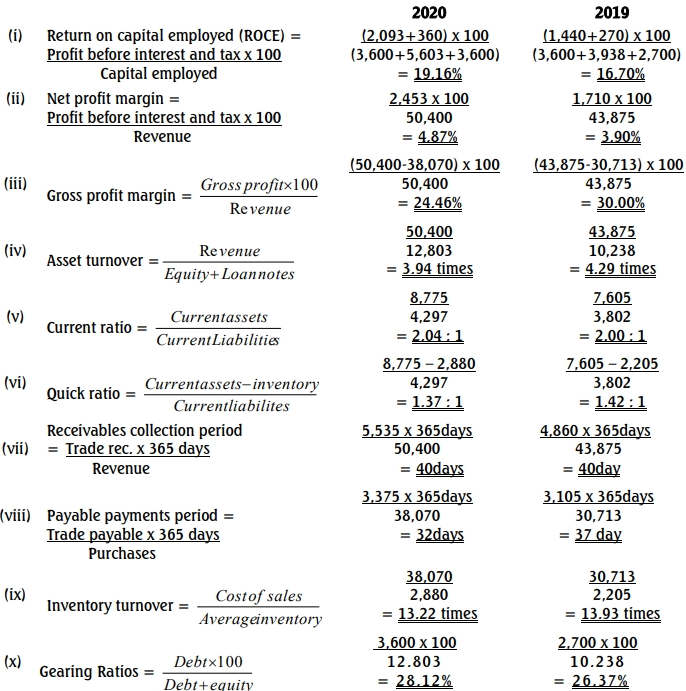
(a) Computation of ratios of Onye Nigeria Plc for years 2019 and 2020
b. Analysis of Performance and Liquidity of Onye Nigeria Plc for Year 2020
- Performance:
- The ROCE of 19.16% in 2020 indicates a strong return on capital, above the industry average of 18.50%.
- The Net Profit Margin of 4.15% shows an improvement compared to 3.29% in 2019, indicating better cost control or increased pricing power.
- The Gross Profit Margin of 24.46% reflects a healthy profit margin, although it is lower than the industry average (35.23%), indicating potential cost issues in sales or production.
- Liquidity:
- The Current Ratio of 2.04:1 suggests strong liquidity, above the industry average of 1.90:1, indicating that the company can cover its short-term liabilities comfortably.
- The Gearing Ratio of 28.12% is within an acceptable range, indicating low financial risk and reliance on debt financing.
c. Limitations of Using Accounting Ratios in Financial Statement Analysis
- Historical Data:
Ratios are based on historical financial data, which may not accurately reflect the current financial situation or future performance of the company. - Industry Variability:
Different industries have different norms for financial ratios, making it difficult to compare ratios across industries. Ratios may not be meaningful if industry averages are not considered. - Manipulation of Accounts:
Companies may use accounting practices to manipulate figures, affecting the reliability of ratios derived from the financial statements. - Qualitative Factors Ignored:
Ratios provide quantitative analysis and may overlook qualitative factors such as management effectiveness, brand strength, or market conditions that can significantly impact a company’s performance. - Economic Changes:
Ratios may become outdated quickly due to economic changes, market dynamics, or regulatory adjustments that affect financial performance.