
- 20 Marks
Question
The summarized comparative financial statements of Odua Plc. for the years ended December 31, 2016, and 2015 are as follows:
Statement of Profit or Loss and Other Comprehensive Income for the Year Ended December 31
| 2016 (N’m) | 2015 (N’m) | |
|---|---|---|
| Revenue | 550 | 400 |
| Cost of Sales | (400) | (200) |
| Gross Profit | 150 | 200 |
| Operating Costs | (72) | (60) |
| Operating Profit | 78 | 140 |
| Investment Income | – | – |
| (Loss)/Gain on Revaluation of Investments | (10) | 20 |
| Finance Costs | (10) | (6) |
| Profit Before Taxation | 58 | 154 |
| Income Tax Expense | (8) | (30) |
| Profit for the Year | 50 | 124 |
| Other Comprehensive Income | ||
| Revaluation Losses on PPE | (90) | – |
| Total Comprehensive Income for the Year | (40) | 124 |
Statement of Financial Position as of December 31
| 2016 (N’m) | 2015 (N’m) | |
|---|---|---|
| Assets | ||
| Non-Current Assets | ||
| Property, Plant, and Equipment | 430 | 490 |
| Investments (Fair Value) | 70 | 80 |
| Total Non-Current Assets | 500 | 570 |
| Current Assets | ||
| Inventory | 80 | 38 |
| Trade Receivables | 104 | 56 |
| Bank | – | 20 |
| Total Current Assets | 184 | 114 |
| Total Assets | 684 | 684 |
| Equity and Liabilities | ||
| Equity | ||
| Equity Shares of N0.50 Each | 240 | 240 |
| Revaluation Reserve | 20 | 110 |
| Retained Earnings | 180 | 130 |
| Total Equity | 440 | 480 |
| Non-Current Liabilities | ||
| Bank Loan | 100 | 100 |
| Current Liabilities | ||
| Trade Payables | 100 | 78 |
| Bank Overdraft | 40 | – |
| Current Tax Payable | 4 | 26 |
| Total Current Liabilities | 144 | 104 |
| Total Equity and Liabilities | 684 | 684 |
Additional Information:
- The Managing Director asserts that Odua Plc has retained book value and has not deteriorated, appraising the company’s new strategy.
- In recent years, Odua Plc has faced difficulties maintaining sales due to a shift to online shopping. In response, Odua launched a price-cutting strategy on January 1, 2016.
- Odua installed a new product movement and control system on January 1, 2016, costing N40 million and depreciated over five years, replacing an older system disposed of at zero consideration.
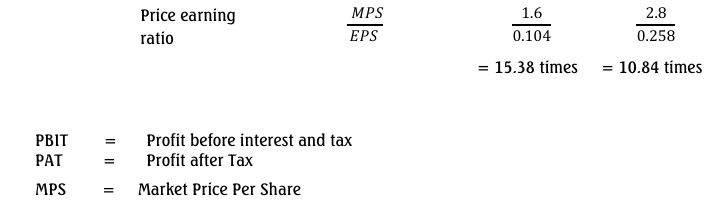
- The share price declined from N2.80 per share on December 31, 2015, to N1.60 per share on December 31, 2016.
Required:
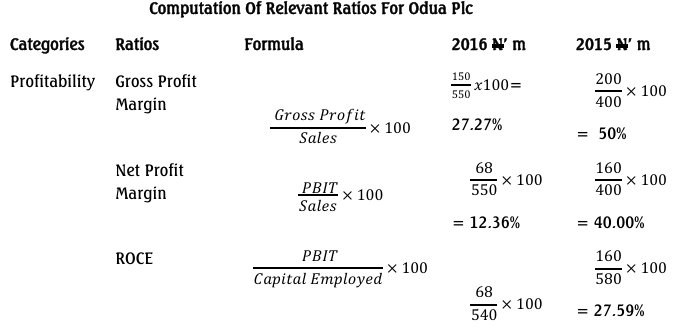
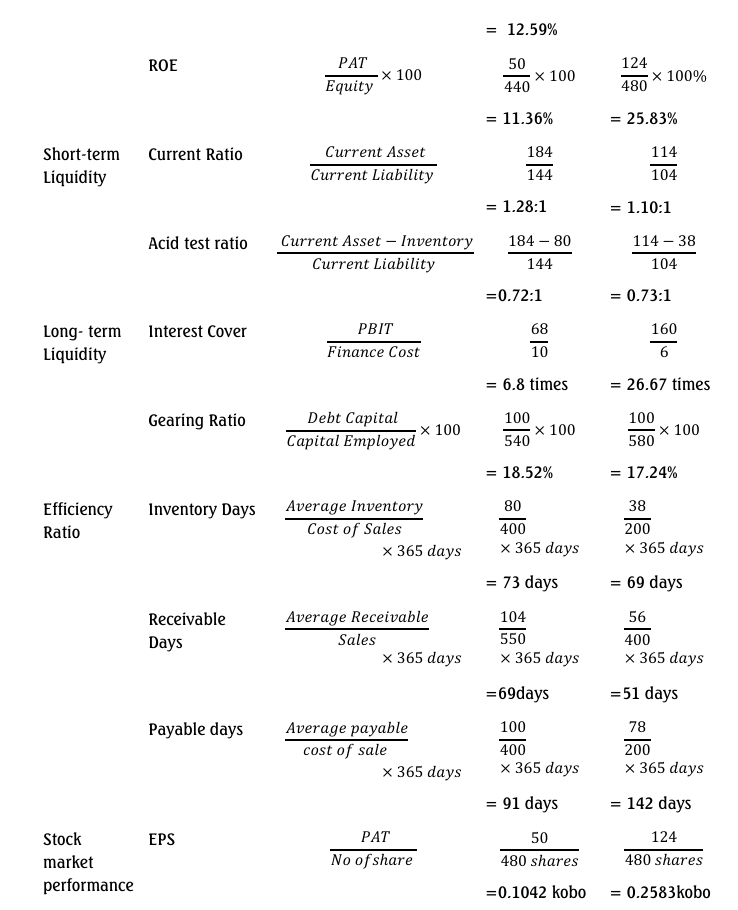
Evaluate and interpret the following ratios under the headings of profitability, efficiency, short-term liquidity, long-term solvency and stability, and stock market performance for each financial year:
- Profitability Ratios: Gross Margin, Net Margin, ROCE, ROE
- Efficiency Ratios: Inventory Days, Receivables Days, Payables Days
- Liquidity Ratios: Current Ratio, Acid Test Ratio
- Solvency Ratios: Interest Cover, Gearing
- Market Ratios: Earnings Per Share, Price Earnings Ratio
Answer
- Tags: Financial Ratios, Liquidity, Market Performance, Profitability, Solvency
- Level: Level 1
- Topic: Presentation of Financial Statements (IAS 1)
- Series: NOV 2017
- Uploader: Dotse