
Question
Answer
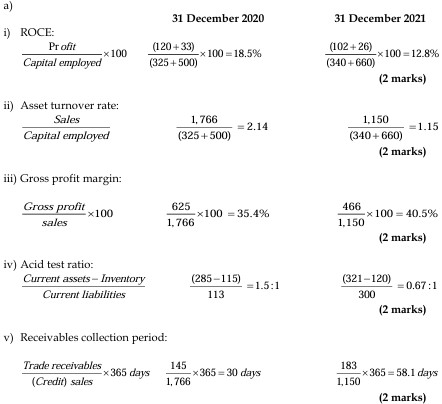
a) Calculation of Ratios for Kotoku Ltd
i) Return On Capital Employed (ROCE):
b) Comments on Financial Performance of Kotoku Ltd
- Return On Capital Employed (ROCE): The ROCE has declined from 18.5% in 2020 to 12.8% in 2021, and it is below the industry standard of 21.2%. This decline indicates that the company is less efficient in generating profits from its capital, which could be a concern for investors seeking better returns.
- Asset Turnover: The asset turnover has also decreased from 2.14 in 2020 to 1.15 in 2021, indicating that the company is generating less revenue from its assets. This lower turnover suggests inefficiency in utilizing assets compared to the industry benchmark of 2.28.
- Gross Profit Margin: Despite the decline in ROCE and asset turnover, the gross profit margin has improved from 35.4% in 2020 to 40.5% in 2021, exceeding the industry average of 38.2%. This suggests better cost management or pricing strategies, leading to improved profitability.
- Acid Test Ratio: The acid test ratio has significantly dropped from 1.5:1 in 2020 to 0.67:1 in 2021, well below the industry standard. This decline indicates potential liquidity problems, as the company may struggle to meet its short-term obligations without relying on inventory sales.
- Receivables Collection Period: The receivables collection period has increased from 30 days in 2020 to 58.1 days in 2021, which is much higher than the industry standard of 35 days. This extended collection period could indicate issues with credit control and may contribute to the company’s liquidity challenges.
(5 points @ 2 marks each = 10 marks)