Question Tag: Ratio Analysis

Search 500 + past questions and counting.
  • Filter by Professional Bodies

  • Filter by Subject

  • Filter by Series

  • Filter by Topics

  • Filter by Levels

CR – Nov 2024 – L3 – Q5b – Financial Performance & Digital Technology Integration

Evaluating the financial performance of Nsawkaw PLC and addressing challenges of digital technology integration in accounting.

(a) Compute the following ratios for the years ended 2024 & 2023:
i) Operating profit margin
ii) Return on parent’s equity
iii) Earnings per share
iv) Current ratio
v) Trade receivables days
vi) Total liabilities to total assets %

(b) Write a report to the directors of DPEF evaluating the inter-period financial performance and position of NK using the above six (6) ratios. The report should draw attention to how the non-financial metrics combine with the financial counterparts to showcase the prospects and viability of NK.                                                                      c) The concept of double materiality is relevant to sustainability impacts and dependencies. It
incorporates financial materiality and impact materiality. 

Login or create a free account to see answers

Find Related Questions by Tags, levels, etc.

Report an error

You're reporting an error for "CR – Nov 2024 – L3 – Q5b – Financial Performance & Digital Technology Integration"

CR – Nov 2024 – L3 – Q5a – Financial Analysis and Investment Evaluation

Compute financial ratios for Nsawkaw PLC to evaluate its financial performance for investment recommendation.

Nsawkaw PLC (NK), a gold processing and trading company, has been identified by Djaraye Private Equity Fund (DPEF) as a target for long-term equity investment. As a financial consultant of DPEF, you have been tasked to evaluate the integrated financial condition of NK and make an investment recommendation.

Below are the summarised versions of NK’s Consolidated Financial Statements for the year ended June 30, 2024 (together with its comparative period):

Summarised Consolidated Statement of Profit or Loss for the year ended 30 June 2024

2024 (GH¢000) 2023 (GH¢000)
Revenue 2,538,000 2,125,000
Operational expenses (1,909,100) (1,592,900)
Interest costs (186,700) (157,250)
Taxation (234,000) (198,500)
Profit after tax 208,200 176,350
Other comprehensive income 17,900 10,550
Total comprehensive income 226,100 186,900

Summarised Consolidated Statement of Changes in Equity for the year ended 30 June 2024

Equity Holders of the Parent (GH¢000) Non-controlling Interests’ Equity (GH¢000) Total Equity (GH¢000)
2024
Balances b/d 457,200 65,600 522,800
Total comprehensive income 190,800 35,300 226,100
Dividends (110,000) (8,700) (118,700)
Balances c/d 538,000 92,200 630,200
2023
Balances b/d 355,000 46,650 401,650
Total comprehensive income 160,500 26,400 186,900
Dividends (58,300) (7,450) (65,750)
Balances c/d 457,200 65,600 522,800

Summarised Statement of Financial Position as at 30 June 2024

2024 (GH¢000) 2023 (GH¢000)
Non-current assets
Property, plant, and equipment 718,000 657,000
Others 156,000 99,000
Total Non-current assets 874,000 756,000
Current assets
Trade receivables 140,000 121,000
Others 236,500 123,050
Total Current assets 376,500 244,050
Total Assets 1,250,500 1,000,050
Total Equity and Liability 1,250,500 1,000,050

Additional information:

  1. The total number of equity shares outstanding was 1.2 million and 1.4 million at 30 June 2023 and 30 June 2024 respectively.
  2. Other comprehensive income attributable to non-controlling interests for the years ended 30 June 2023 and 2024 amounted to GH¢8.05 million and GH¢9.6 million respectively.
  3. Non-current liabilities at 30 June 2023 and 30 June 2024 amounted to GH¢250,800 and GH¢308,510 respectively.
  4. The following metrics have been gleaned from NK’s published sustainability reports across the two years:
Metric 2024 2023
Scope 1 & 2 carbon emissions (tonnes of CO2) 650 780
Scope 3 carbon emissions (tonnes of CO2) 2,400 2,380
Women in senior management (%) 21 16
Total recordable injury frequency rate (TRIFR) per 100 full-time workers 3.3 4.1

The scope and definitions of the above sustainability measures have remained materially unchanged across the two years.

Required:

Compute the following ratios for the years ended 2024 & 2023:

  1. Operating profit margin
  2. Return on parent’s equity
  3. Earnings per share
  4. Current ratio
  5. Trade receivables days
  6. Total liabilities to total assets %

Login or create a free account to see answers

Find Related Questions by Tags, levels, etc.
Report an error

You're reporting an error for "CR – Nov 2024 – L3 – Q5a – Financial Analysis and Investment Evaluation"

PSAF – Nov 2024 – L2 – Q4a – Financial Ratio Analysis

Compute financial ratios for Ghana Wind Farms LTD to analyze performance trends.

Ghana Wind Farms LTD, a State-Owned Enterprise (SOE), has appointed a new Board of Directors in January 2023. The new Board, after settling for a year, is interested in assessing their performance for the year 2023 against the performance of the previous Board in the year 2022 through ratio analysis. Below is the financial statement of Ghana Wind Farms LTD for the two years.


Ghana Wind Farms LTD

Statement of Profit or Loss for the Year Ended 31 December 2023

2023 (GH¢) 2022 (GH¢)
Revenue 9,860,000 6,218,000
Direct Cost (5,905,000) (5,822,000)
Gross Profit 3,955,000 396,000
Distribution Costs (297,000) (264,000)
Administrative Expenses (505,000) (455,000)
Other Income 236,000 13,000
Other Gains 1,482,000
Operating Profit 3,389,000 1,172,000
Finance Cost (1,000,000) (334,000)
Profit Before Tax Expense 2,389,000 838,000
Tax Expense (500,000) (144,000)
Profit After Tax 1,889,000 694,000

Ghana Wind Farms LTD

Statement of Financial Position as at 31 December 2023

2023 (GH¢) 2022 (GH¢)
ASSETS
Non-Current Assets
Property, Plant & Equipment 17,000,000 15,000,000
Investment 5,000 2,000
Advances & Loans 30,000
Total Non-Current Assets 17,005,000 15,032,000
Current Assets
Inventories 687,000 546,000
Trade and Other Receivables 2,829,000 1,978,000
Prepayments 87,000 42,000
Cash and Cash Equivalents 383,000 434,000
Total Current Assets 3,986,000 3,000,000
TOTAL ASSETS 20,991,000 18,032,000
EQUITY & LIABILITIES
Equity
Government Equity 8,000 8,000
Other Government Equity 613,000 306,000
Capital Surplus 8,471,000 7,599,000
Income Surplus (1,434,000) 478,000
Total Equity 7,970,000 8,697,000
Non-Current Liabilities
Deferred Credit 6,692,000 670,000
Deferred Tax Liabilities 2,498,000 2,572,000
Borrowings (Due After One Year) 1,297,000 950,000
Total Non-Current Liabilities 10,487,000 4,192,000
Current Liabilities
Bank Overdraft 166,000 180,000
Provision for Company Tax 109,000 109,000
Trade and Other Payables 1,820,000 4,516,000
Borrowings (Due Within One Year) 439,000 338,000
Total Current Liabilities 2,534,000 5,143,000
Total Liabilities 13,021,000 9,335,000
TOTAL EQUITY AND LIABILITIES 20,991,000 18,032,000

Required:

a) Compute the following ratios:

i) Current Ratio
ii) Quick Ratio
iii) Inventory Turnover (Days)
iv) Trade Receivable Collection Period (Days)
v) Trade Payables Period (Days)
vi) Working Capital Cycle
vii) Interest Cover Ratio
viii) Total Debt – Total Asset Ratio

Login or create a free account to see answers

Find Related Questions by Tags, levels, etc.
Report an error

You're reporting an error for "PSAF – Nov 2024 – L2 – Q4a – Financial Ratio Analysis"

FR – Nov 2024 – L2 – Q4b – Financial Performance Assessment of Acquisition Targets

Assessment of financial performance and position of Suah LTD and Nagbe LTD to assist Dukuly LTD in an acquisition decision.

Dukuly LTD, a public entity, has been expanding through acquisitions. It is assessing two potential acquisition targets, Suah LTD and Nagbe LTD, both operating in the same industry.

The financial statements of Suah LTD and Nagbe LTD for the year ended 30 September 2024 have been provided, along with a set of financial ratios calculated for Suah LTD.

Required:
Using the calculated ratios for Nagbe LTD from Question 4a, assess the relative financial performance and financial position of Suah LTD and Nagbe LTD, to assist the directors of Dukuly LTD in making an acquisition decision.

Login or create a free account to see answers

Find Related Questions by Tags, levels, etc.
Report an error

You're reporting an error for "FR – Nov 2024 – L2 – Q4b – Financial Performance Assessment of Acquisition Targets"

FR – Nov 2024 – L2 – Q4a – Financial Ratios and Performance Evaluation

Calculation of key financial ratios for Nagbe LTD to compare with Suah LTD and evaluate financial performance.

Dukuly LTD, a public entity, has been expanding through acquisitions. It is assessing two potential acquisition targets, Suah LTD and Nagbe LTD, which operate in the same industry. The indicative price for acquiring either entity is GH¢12 million.

The financial statements for Suah LTD and Nagbe LTD are provided as follows:

Statement of Profit or Loss for the year ended 30 September 2024

Item Suah LTD (GH¢’000) Nagbe LTD (GH¢’000)
Revenue 25,000 40,000
Cost of Sales (19,000) (32,800)
Gross Profit 6,000 7,200
Distribution & Admin Expenses (1,250) (2,300)
Finance Costs (250) (900)
Profit Before Tax 4,500 4,000
Income Tax Expense (900) (1,000)
Profit for the Year 3,600 3,000

Statement of Financial Position as at 30 September 2024

Item Suah LTD (GH¢’000) Nagbe LTD (GH¢’000)
Non-Current Assets 4,800 10,300
Current Assets 4,800 8,700
Total Assets 9,600 19,000
Equity 2,600 5,600
Non-Current Liabilities 5,000 9,200
Current Liabilities 2,000 4,200
Total Equity & Liabilities 9,600 19,000

Additional Information:

  1. Carrying Amount of Plant Assets:

    • Suah LTD: GH¢4,800,000
    • Nagbe LTD: GH¢2,000,000
  2. The following ratios for Suah LTD are provided:

    Ratio Suah LTD
    Return on Capital Employed (ROCE) 62.5%
    Net Asset Turnover 3.3 times
    Gross Profit Margin 24.0%
    Profit Margin (Before Interest & Tax) 19.0%
    Current Ratio 2.4:1
    Inventory Holding Period 31 days
    Trade Receivables Collection Period 31 days
    Trade Payables Payment Period 24 days
    Gearing Ratio 65.80%
    Acid Test Ratio 1.6:1

Required:
Using the financial statements provided, calculate the corresponding ratios for Nagbe LTD to compare with Suah LTD.

Login or create a free account to see answers

Find Related Questions by Tags, levels, etc.
Report an error

You're reporting an error for "FR – Nov 2024 – L2 – Q4a – Financial Ratios and Performance Evaluation"

CR – May 2019 – L3 – Q2 – Accounting Policies, Changes in Accounting Estimates, and Errors (IAS 8)

Assess the accounting treatment of a policy change and analyze the profitability, liquidity, and efficiency ratios of the company based on the financial statements.

Below is the draft financial statement of Lanwani Plc., a manufacturer of fast-moving consumer goods.

Statement of financial position as at

Statement of profit or loss

Additional Information:

  1. The company changed its accounting policy from the cost model to the revaluation model for its property. The revaluation reserve represents the revaluation surplus recognized in 2017. No adjustment was made for 2016.
  2. Development costs of ₦45 billion were capitalized during 2017. The related asset is not expected to generate economic benefits until 2020.

Required:
a. Assess the accounting treatment of the change in accounting policy and state the impact on the return on capital employed (ROCE). (3 Marks)
b. Analyze the profitability, liquidity, and efficiency of Lanwani Plc. (15 Marks)
c. Briefly discuss TWO limitations of the analysis done in (b) above. (2 Marks)

Login or create a free account to see answers

Find Related Questions by Tags, levels, etc.

Report an error

You're reporting an error for "CR – May 2019 – L3 – Q2 – Accounting Policies, Changes in Accounting Estimates, and Errors (IAS 8)"

AAA – Nov 2011 – L3 – SA – Q17 – Audit Reporting

Identifies the technique involving ratios and statistical analysis to obtain audit evidence.

The computation of ratios and trends and the use of statistical formula to obtain audit evidence is:

  • A. Hot review
  • B. Audit sampling
  • C. Substantive test
  • D. Analytical review
  • E. Audit review

Login or create a free account to see answers

Find Related Questions by Tags, levels, etc.

Report an error

You're reporting an error for "AAA – Nov 2011 – L3 – SA – Q17 – Audit Reporting"

CR – May 2024 – L3 – SB – Q2 -Consolidated Financial Statements (IFRS 10)

Memo advising on acquisition decision based on financial analysis of Betta and Gamma Ltd.

Alpha PLC is an entity which has grown in recent years by acquiring established businesses. Alpha PLC is contemplating acquiring Betta Limited and Gamma Limited, both operating in the same industry as Alpha PLC. The management of Alpha PLC has indicated a total acquisition price of N12 million for each company. The following financial statements provide insight into the performance and financial position of both Betta Limited and Gamma Limited as at September 30, 2020:

  1. Statement of Profit or Loss (for the year ended September 30, 2020):
    Betta Ltd (N’000) Gamma Ltd (N’000)
    Revenue 25,000 40,000
    Cost of sales (19,000) (32,800)
    Gross profit 6,000 7,200
    Distribution costs (800) (1,400)
    Administrative expenses (450) (900)
    Finance costs (250) (900)
    Profit before tax 4,500 4,000
    Income tax expense (900) (1,000)
    Profit for the year 3,600 3,000
  2. Statement of Financial Position (as at September 30, 2020):
    Betta Ltd (N’000) Gamma Ltd (N’000)
    Non-current assets
    Property, plant and equipment
    – Property 3,000
    – Owned plant and equipment 4,800 2,000
    – Leased plant and equipment 5,300
    Total non-current assets 4,800 10,300
    Current assets
    Cash at bank and in hand 1,600 200
    Trade receivables 1,600 5,100
    Inventories 1,600 3,400
    Total current assets 4,800 8,700
    Total assets 9,600 19,000
    Equity and liabilities
    Ordinary shares (N1.00 each) 1,000 2,000
    Revaluation surplus on property 900
    Retained earnings 1,600 2,700
    Total equity 2,600 5,600
    Non-current liabilities
    Finance lease obligation 4,200
    5% loan notes (Dec 2026) 5,000
    10% loan notes (Dec 2026) 5,000
    Total non-current liabilities 5,000 9,200
    Current liabilities
    Trade payables 1,250 2,100
    Finance lease obligation 1,000
    Tax payable 750 1,100
    Total current liabilities 2,000 4,200
    Total equity and liabilities 9,600 19,000
  3. Additional Ratios Calculated:
    • Gross profit margin: Betta 24.0%, Gamma 18.0%
    • Profit margin (before interest and tax): Betta 19.0%, Gamma 12.3%
    • Return on capital employed (ROCE): Betta 62.5%, Gamma 31.0%
    • Current ratio: Betta 2.4:1, Gamma 2.1:1
    • Acid test ratio: Betta 1.6:1, Gamma 1.26:1
    • Net assets turnover: Betta 3.3 times, Gamma 2.5 times
    • Gearing: Betta 65.8%, Gamma 64.6%

Required:

a. Write a memo to the Director of Alpha PLC advising him on how to make the investment decision considering the performance and financial position of Betta Limited and Gamma Limited for the year ended September 30, 2020. (14 Marks)

b. What other qualitative factors should the management of Alpha PLC take into consideration assuming Gamma Limited is a foreign subsidiary? (6 Marks)

Login or create a free account to see answers

Find Related Questions by Tags, levels, etc.
Report an error

You're reporting an error for "CR – May 2024 – L3 – SB – Q2 -Consolidated Financial Statements (IFRS 10)"

CR – May 2018 – L3 – SB – Q2 – Associates and Joint Ventures (IAS 28

Calculate and interpret key financial ratios for Wole-Adura Group and evaluate liquidity.

Set out below are the draft accounts of Wole-Adura Plc and subsidiaries and of Maseru Associates. Wole-Adura acquired 40% of the equity capital of Maseru Associates three years ago when the latter’s retained earnings stood at N140m.

Abridged statement of financial position

Wole-Adura Plc & Subsidiaries Maseru Associates
Property, plant, and equipment 990 Nm
Investment in Maseru Associates at cost 290 Nm
Loan to Maseru Associates 70 Nm
Current assets 450 Nm
Loan from Wole-Adura Plc.
Total Assets 1800 Nm

FINANCED BY:

| Ordinary shares of 50k each | 1,125 Nm | 350 Nm | | Retained earnings | 675 Nm | 350 Nm | | Total Equity | 1800 Nm | 700 Nm |

Abridged statements of profit or loss

Wole-Adura Plc & Subsidiaries Maseru Associates
Profit before tax 427.50 Nm
Tax expense (157.50 Nm)
Profit after tax 270.00 Nm

Additional information:

(i) Wole-Adura proposed a dividend of N225m.
(ii) Total market capitalisation is N5,625m.


Required:

(a) Calculate each of these ratios for Wole-Adura Plc. and subsidiaries:

  1. Earnings per share
  2. Dividend cover
  3. Earnings yield
  4. Dividend yield

(4 Marks)

(b)

  1. Using the equity method, compute the earnings of the group incorporating the associates. (4 Marks)
  2. Compute the ratios in (a) above for the group. (4 Marks)

(c) Comment on the ratios calculated in (a) and (b) above by pairwise comparison. (3 Marks)

(d) Extracts from the financial statements of Ikoku Plc. recently published are as follows:

Statement of profit or loss for the year ended December 31, 2017

2017 2016
Revenue 360 Nm
Cost of sales (150 Nm)
Gross profit 210 Nm
Operating expenses (50 Nm)
Operating profit 160 Nm
Interest expense (10 Nm)
Tax expense (60 Nm)
Profit for the year 90 Nm

Statement of financial position as at December 31, 2017

2017 2016
Non-current assets
Property, plant & equipment 80 Nm
Current assets
Inventory 200 Nm
Trade receivables 70 Nm
Bank (50 Nm)
Total assets 300 Nm

Equity & liabilities

| Ordinary shares of N1 each | 60 Nm | 40 Nm | | Current liabilities | | | Trade payables | 190 Nm | 60 Nm | | Current tax | 50 Nm | 15 Nm | | Total liabilities and equity | 300 Nm | 115 Nm |

Required:

Discuss the liquidity challenges of Ikoku Plc. during the year ended December 31, 2017, from the extracts of the published financial statements. (5 Marks)

(Total 20 Marks)

Login or create a free account to see answers

Find Related Questions by Tags, levels, etc.
Report an error

You're reporting an error for "CR – May 2018 – L3 – SB – Q2 – Associates and Joint Ventures (IAS 28"

FR – Nov 2023 – L2 – Q2 – Business Combinations (IFRS 3)

Analyze Oyowood Limited's financials and adjust ratios based on acquisition considerations.

Chisom Plc experienced rapid growth in recent years through the acquisition and integration of other companies. Chisom Plc is interested in acquiring Oyowood Limited, a retailing company, which is one of several companies owned and managed by the same family.

The summarized financial statements of Oyowood Limited for the year ended December 31, 2022, are as follows:

From the above financial statements, Chisom Plc has calculated for Oyowood Limited the ratios below for the year ended December 31, 2022. It has also obtained the equivalent ratios for the retail sector average, which can be taken to represent Oyowood‟s sector.

Additional Information:

  1. Oyowood Limited buys all inventories from family companies at a 10% discount below market prices.
  2. Post-acquisition, Chisom Plc would replace the board of directors with a new board at a remuneration cost of ₦2.5 million per annum.
  3. Directors’ loan accounts will be refinanced through a 10% interest-bearing commercial loan of the same amount.
  4. The purchase price for Oyowood Limited is expected to be ₦30 million.

Required:

a. As the financial analyst for Chisom Plc, recalculate the ratios for Oyowood Limited after adjustments based on points (i) to (iv) above. (10 Marks)

b. Draft a memo to the managing director of Chisom Plc commenting on the adjusted performance of Oyowood Limited. (10 Marks)

Login or create a free account to see answers

Find Related Questions by Tags, levels, etc.

Report an error

You're reporting an error for "FR – Nov 2023 – L2 – Q2 – Business Combinations (IFRS 3)"

FR – May 2016 – L2 – Q4 – Business Combinations (IFRS 3)

Calculate and assess Quintet Plc's performance against industry averages using ratio analysis.

Quintet Plc sells provisions through its stores located in various retail shopping centers in the major cities in Nigeria. It has recently been experiencing declining profitability, and the board is concerned whether this issue is specific to the company or related to the sector as a whole. Additionally, concerns regarding the company’s solvency have been raised. To address these, the company has engaged a consulting firm specializing in corporate report analysis to provide average ratios across the business sector to rate performance.

Below are the ratios provided by the consulting firm for Quintet Plc’s business sector based on the year ending June 30, 2015:

  • Debt to equity: 38%
  • Gross profit margin: 35%
  • Operating profit margin: 12%
  • Return on year-end capital employed (ROCE): 16.8%
  • Net asset turnover: 1.4 times
  • Current ratio: 1.25:1
  • Average inventory turnover: 3 times
  • Trade payables’ payment period: 64 days

The financial statements of Quintet Plc for the year ending September 30, 2015, are as follows:

Income Statement

Item Amount (N’000)
Revenue 224,000
Opening Inventory 33,200
Purchases 175,600
Closing Inventory (40,800)
Gross Profit 56,000
Operating Costs (39,200)
Finance Costs (3,200)
Profit Before Tax 13,600
Income Tax Expense (4,000)
Profit for the Year 9,000

Statement of Financial Position

Item Amount (N’000)
Assets
Non-current assets
Property and shop fittings 102,400
Deferred development expenditure 20,000
Total Non-current assets 122,400
Current Assets
Inventory 40,800
Bank 4,000
Total Current Assets 44,800
Total Assets 167,200
Equity and Liabilities
Equity
Equity shares of N1 each 60,000
Property revaluation reserve 12,000
Retained earnings 34,400
Total Equity 106,400
Non-current Liabilities
10% loan notes 32,000
Current Liabilities
Trade payables 21,600
Current tax payable 7,200
Total Current Liabilities 28,800
Total Equity and Liabilities 167,200

Note:

  1. Net asset is defined by the consulting firm as total assets less current liabilities.
  2. The deferred development expenditure relates to a one-off payment for a franchise as a sole distributor of a particular product under negotiation but not concluded as of September 30, 2015, although payment has been made.

Required:

a) Compute the equivalent ratios for Quintet Plc provided by the consulting firm for the business sector.
(9 Marks)

b) Write a report to the board assessing the profitability and solvency performance of Quintet Plc compared to its business sector averages. For clarity, solvency measures both liquidity and gearing.
(11 Marks)

Login or create a free account to see answers

Find Related Questions by Tags, levels, etc.

Report an error

You're reporting an error for "FR – May 2016 – L2 – Q4 – Business Combinations (IFRS 3)"

FR – May 2015 – L2 – SB – Q6 – Associates and Joint Ventures (IAS 28)

Explain the equity method, conditions for discontinuation, and evaluate types of audit evidence.

(a) IAS 28 – Investments in Associates and Joint Ventures permits the application of the equity method when accounting for investments in associates and joint ventures.

Required:
Explain briefly the Equity Method and state the circumstances under which an entity can discontinue the use of the equity method under IAS 28. (5 Marks)


(b) Agbantara Plc. acquired equity shares from Odinma Plc. and Dangari Limited. The following are the Statements of Profit or Loss and Other Comprehensive Income for the year ended 31 December 2014 for the three companies:

Company Agbantara Plc. Odinma Plc. Dangari Ltd
Revenue N4,500 N1,350 N630
Cost of Sales (N2,430) (N720) (N270)
Gross Profit N2,070 N630 N360
Admin Expenses (N1,350) (N180) (N135)
Finance Income N135 N90
Finance Costs (N180) (N90)
Profit Before Tax N675 N540 N135
Income Tax Expense (N225) (N135) (N45)
Profit for the Year N450 N405 N90

Other Comprehensive Income:

  • Gains on Property Revaluation (Net of Tax):
    • Agbantara Plc: N180
    • Odinma Plc: N90
    • Dangari Ltd: N45

Total Comprehensive Income for the Year:

  • Agbantara Plc: N630
  • Odinma Plc: N495
  • Dangari Ltd: N135

Additional Information:
(i) Agbantara Plc. acquired 72 million ordinary shares in Odinma Plc. out of its 120 million ordinary shares at a nominal par value of N1 each for N160 million. The shares were acquired four years ago when Odinma Plc. had a N15 million credit balance in retained earnings. During the year, Odinma Plc. sold goods costing N38 million to Agbantara Plc. for N45 million, which remain unsold at year-end.
(ii) Agbantara Plc. acquired 35,000,000 ordinary shares in Dangari Limited out of 100,000,000 ordinary shares. The shares were acquired three years ago when the company had a credit balance on its retained
earnings of N10,000,000.
(iii) Agbantara Plc’s group policy is to measure non-controlling interests (NCI) at fair value. NCI at acquisition date in Odinma Plc. at fair value was N48,000,000. Impairment test carried out on the goodwill relating to Odinma Plc. and investment in Dangari Limited at year end resulted in N10,000,000 and N15,000,000 losses respectively.

Required:
Calculate Agbantara Plc.’s share of profits from Odinma Plc., considering the unrealized profit. (5 Marks)

Login or create a free account to see answers

Find Related Questions by Tags, levels, etc.

Report an error

You're reporting an error for "FR – May 2015 – L2 – SB – Q6 – Associates and Joint Ventures (IAS 28)"

FR – May 2021 – L2 – Q5 – Performance Analysis

Analyze profitability, liquidity, and financial stability of Pepeyoyo Limited based on provided ratios.

You are the Chief Accountant of Jolmarg Nigeria Limited. Pepeyoyo Limited is a competitor in the same industry as Jolmarg and has been operating for the past 20 years.

The following is the result of Pepeyoyo Limited for the last three years ended December 31:

Ratios 2016 2017 2018
Gross profit margin (%) 34 34.4 35.4
ROCE (%) 21.1 21.5 17.8
Net profit margin (%) 11.9 12.4 11.4
Asset turnover (times) 1.78 1.73 1.56
Gearing ratio (%) 15.6 24.3 23.6
Debt ratio (%) 18.5 32.0 30.9
Interest cover (times) 16.7 8.1 5.5
Current ratio 3:1 2.8:1 2.7:1
Quick ratio 1.2:1 1.1:1 1.1:1
Receivable collection period (days) 46 52 64
Inventory turnover period (days) 158 171 182
Payable payment period (days) 35 42 46

Required:

a. Write a report to the finance director of Jolmarg Nigeria Limited analyzing the performance (profitability, liquidity, and long-term financial stability) of Pepeyoyo Limited based on the information available.
(10 Marks)

b. Identify FIVE areas which require further investigation, including references to other pieces of information which would complement your analysis of the performance of Pepeyoyo Limited.
(10 Marks)

Login or create a free account to see answers

Find Related Questions by Tags, levels, etc.

Report an error

You're reporting an error for "FR – May 2021 – L2 – Q5 – Performance Analysis"

FR – Nov 2015 – L2 – Q3 – Presentation of Financial Statements (IAS 1)

Calculation of accounting ratios for creditors, management, and shareholders with comparisons between 2013 and 2014.

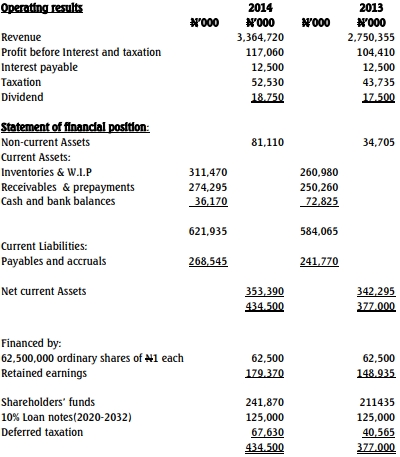
The summarized final accounts of Omosigho Ltd, manufacturer of Aluminum roofing sheets and its accessories, for two years ended December 31, 2013, and 2014 were as follows:

Required:
a. Calculate TWO accounting ratios each that will be of interest to the following stakeholders:
i. Creditors
ii. Management
iii. Shareholders
(15 Marks)

b. Comment briefly on the changes between the ratios arrived at in 2013 and 2014.
(5 Marks)

Login or create a free account to see answers

Find Related Questions by Tags, levels, etc.

Report an error

You're reporting an error for "FR – Nov 2015 – L2 – Q3 – Presentation of Financial Statements (IAS 1)"

FR – NOV 2016 – L2 – Q3 – Presentation of Financial Statements (IAS 1)

Analysis of company's financial performance through ratio analysis and preparation of technical report evaluating liquidity, stability and performance.

Magifera Plc had been trading in merchandise for several years in Garden City. The information below relates to extracts from the Financial Statements for the past two (2) years.

Statement of Profit or Loss and Other Comprehensive Income for the year ended September 30:

2016 2015
N’ Million N’ Million
Revenue 100,000 160,000
Gross Profit 45,000 70,000
Administrative Expenses 22,500 27,500
Finance Cost:
10% Loan Note Interest 1,250 1,250
23,750 28,750
Operating Profit Before Tax 21,250 41,250
Less: Taxation Expense 8,000 16,000
Operating Profit for the year 13,250 25,250
Dividends Paid to Equity holders 6,050 8,550

Extract of Statement of Financial Position as at September 30

2016 2015
N’Million N’Million
Assets:
Non – Current Assets at Cost 50,000 70,000
Less: Accumulated Depreciation 10,000 12,500
Carrying Amount 40,000 57,500
Current Assets:
Inventory 32,500 7,500
Trade Receivables 20,000 5,000
Bank Balance 4,000 37,500
56,500 50,000
Total Assets 96,500 107,500
Equity and Liabilities:
Ordinary Share Capital @ 50k each 23,000 23,000
Retained Earnings 17,200 10,000
10% Loan notes 12,500 12,500
10% Redeemable Preference Shares _______ 2,000
52,700 47,500
Current Liabilities:
Trade Payables 7,500 10,750
Taxation 24,000 16,000
Bank Overdrafts 12,300 33,250
43,800 60,000
Total Equity and Liabilities 96,500 107,500

The Board of Directors were worried over the dwindling financial performance and precarious financial position of the company. The products are ageing; the economic depression is biting as a result of the worsening exchange rate of $1 to N400. The company imports 60% of the goods sold in Garden City. The worsening exchange rate had affected the company’s importation, consequently the revenue of the company dropped significantly. The unsafe financial performance has also affected the market price of the company’s share which dropped from 12kobo/share in the year ended September 30, 2015 to 8kobo/share in 2016.

You are required to:

a. Calculate the following ratios for the year ended September 30, 2015 and 2016 in columnar form:

i. Return on Capital Employed

ii. Total Assets Turnover

iii. Quick Ratio

iv. Debt- Equity Ratio

v. Fixed Interest Cover

vi. Earnings Yield

vii. Price Earnings Ratio

viii. Dividend Yield (12 Marks)

b. Write a brief and formal technical report to the Board of Directors to assess the performance, liquidity and stability of the Company using only: i. Return on Capital Employed

ii. Total Assets Turnover

iii. Quick Ratio

iv. Fixed Interest Cover

v. Debt Equity Ratio (8 Marks)

Login or create a free account to see answers

Find Related Questions by Tags, levels, etc.

Report an error

You're reporting an error for "FR – NOV 2016 – L2 – Q3 – Presentation of Financial Statements (IAS 1)"

PSAF – May 2019 – L2 – Q1 – Public Sector Financial Statements

Analyze financial ratios for a hotel transitioning to a public-private partnership.

National Hotel, an investment unit of the Ministry of Tourism and Environment, is fifty (50) years old. It has recently been restructured from a wholly-owned government hotel to a private/government partnership. However, being the largest hotel in the country and for security reasons, the government still retains 55% of its equity.

The board of directors has decided to reposition the hotel for better performance, needing external finances amounting to N180 million, consisting of a N100 million loan over ten years and an N80 million bank overdraft. All necessary supports have been provided by the government and private equity holders.

The summarized results for the last two financial years are as follows:

Income Statement

Year ended 30 September 2013 (N’000) 2014 (N’000)
Turnover 200,000 240,000
Cost of Sales (150,000) (184,000)
Gross Profit 50,000 56,000
Overhead Expenses (10,000) (12,000)
Profit before Tax 40,000 44,000

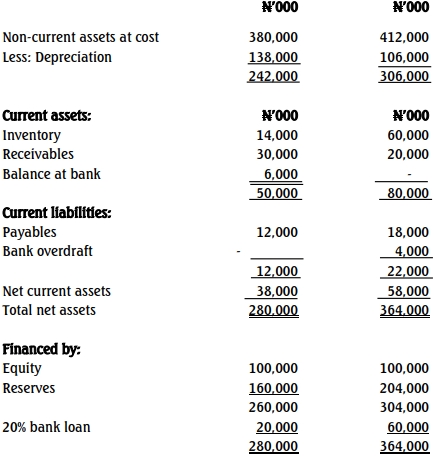
Statement of Financial Position

You have been engaged as a consultant to assist the hotel in preparing necessary documents and reports to achieve its objectives.

Required:
a. Calculate six relevant accounting ratios covering each of the two years: 2013 and 2014 in a tabular form. (12 Marks)

b. Interpret the result of the ratios calculated in (a) above to show the financial performance and position of the entity. (12 Marks)

c. Highlight four unfavorable factors about the hotel as revealed by your interpretation. (6 Marks)

Login or create a free account to see answers

Find Related Questions by Tags, levels, etc.

Report an error

You're reporting an error for "PSAF – May 2019 – L2 – Q1 – Public Sector Financial Statements"

CR – Nov 2020 – L3 – Q5d – Performance Analysis

Report on the performance and state of the business using calculated ratios from the viewpoint of shareholders and lenders.

Report on the performance and state of the business from the viewpoint of a potential shareholder and lender using the ratios calculated above and explain any weaknesses in these ratios.


Login or create a free account to see answers

Find Related Questions by Tags, levels, etc.

Report an error

You're reporting an error for "CR – Nov 2020 – L3 – Q5d – Performance Analysis"

CR – May 2021 – L3 – Q5 – Financial performance of Shop First Ltd

Analyze the financial performance of Shop First Ltd for 2020 and discuss the effects of discontinued operations and contingencies.

Shop First Ltd operates supermarket chains across the sixteen (16) regions of Ghana. The firm has been in commercial operation for more than two decades, growing its operations through an effective supply chain and financial management. However, in the last few years, keen competition and worsening general economic performance have steadied the consistent growths experienced over the years, resulting in the entity disposing off part of its operations. Below are the financial statements of Shop First Ltd:

Login or create a free account to see answers

Find Related Questions by Tags, levels, etc.

Report an error

You're reporting an error for "CR – May 2021 – L3 – Q5 – Financial performance of Shop First Ltd"

FR – May 2020 – L2 – Q4b – Financial Performance Analysis

Write a report analyzing Adenta Ltd's financial performance in comparison to industry averages for 2018.

As the Financial Controller of Adenta Ltd, write a report to the Board of Directors analyzing the financial performance of Adenta Ltd based on a comparison with the industry averages. (10 marks)


Login or create a free account to see answers

Find Related Questions by Tags, levels, etc.

Report an error

You're reporting an error for "FR – May 2020 – L2 – Q4b – Financial Performance Analysis"

FR – May 2019 – L2 – Q3 – Statement of Cash Flows (IAS 7)

Calculation of cash operating cycle and comparative ratios for Kobape Limited, and analysis of company performance through a report.

Shown below are the financial statements of Kobape Limited for its most recent two years.

Extract from the statement of profit or loss for the year ended 30 April:

2019 (N’000) 2018 (N’000)
Revenue 224,000 195,000
Cost of sales (169,200) (136,500)
Gross profit 54,800 58,500
Administrative costs (32,700) (38,040)
Distribution costs (10,900) (12,680)
Finance cost (1,900) (1,380)
Profit before tax 9,300 6,400

Statement of financial position as at 30 April:

Assets (N’000) 2019 2018
Non-current assets 37,000 28,600
Current assets:
– Inventory 12,800 9,800
– Trade receivables 24,600 21,600
– Cash balance 1,600 2,400
Total assets 76,000 62,400

Equity and liabilities:

2019 2018
Ordinary share capital 16,000 16,000
Retained earnings 26,200 18,600
Non-current liabilities:
– 10% loan notes 16,000 12,000
Current liabilities:
– Bank overdraft 2,200 1,600
– Trade payables 15,000 13,800
– Taxation 600 400
Total equity and liabilities 76,000 62,400

The following are the ratios calculated for Kobape Limited based on the financial statements of the previous year and also the latest industry average ratios:

Ratio Kobape Ltd (30 April 2018) Industry Average
Net profit margin 3.99% 4.73%
ROCE (Capital employed = equity + loan notes) 16.69% 18.50%
Asset turnover 4.19 times 3.91 times
Current ratio 2.14:1 1.90:1
Quick ratio 1.52:1 1.27:1
Gross profit margin 30.0% 35.23%
Account receivables collection period 40 days 52 days
Account payables payment period 37 days 49 days
Inventory turnover (times) 13.9 times 18.3 times
Gearing ratio 25.75% 32.71%

Required:
a. Calculate the cash operating cycle of Kobape Limited for the year ended 30 April, 2018 and 2019. (5 Marks)

b. Calculate the comparative ratio(s) (to two decimal places where appropriate) for Kobape Limited for the year ended 30 April, 2019. (5 Marks)

c. Draft a report addressed to the board of directors of Kobape Limited, analyzing the performance of the company for the year 2019 based on the result of the previous year and the industry average. (10 Marks)

Login or create a free account to see answers

Find Related Questions by Tags, levels, etc.

Report an error

You're reporting an error for "FR – May 2019 – L2 – Q3 – Statement of Cash Flows (IAS 7)"

Oops!

This feature is only available in selected plans.

Click on the login button below to login if you’re already subscribed to a plan or click on the upgrade button below to upgrade your current plan.

If you’re not subscribed to a plan, click on the button below to choose a plan