Question Tag: Profitability

Search 500 + past questions and counting.
  • Filter by Professional Bodies

  • Filter by Subject

  • Filter by Series

  • Filter by Topics

  • Filter by Levels

CR – Nov 2024 – L3 – Q5a – Financial Analysis and Investment Evaluation

Compute financial ratios for Nsawkaw PLC to evaluate its financial performance for investment recommendation.

Nsawkaw PLC (NK), a gold processing and trading company, has been identified by Djaraye Private Equity Fund (DPEF) as a target for long-term equity investment. As a financial consultant of DPEF, you have been tasked to evaluate the integrated financial condition of NK and make an investment recommendation.

Below are the summarised versions of NK’s Consolidated Financial Statements for the year ended June 30, 2024 (together with its comparative period):

Summarised Consolidated Statement of Profit or Loss for the year ended 30 June 2024

2024 (GH¢000) 2023 (GH¢000)
Revenue 2,538,000 2,125,000
Operational expenses (1,909,100) (1,592,900)
Interest costs (186,700) (157,250)
Taxation (234,000) (198,500)
Profit after tax 208,200 176,350
Other comprehensive income 17,900 10,550
Total comprehensive income 226,100 186,900

Summarised Consolidated Statement of Changes in Equity for the year ended 30 June 2024

Equity Holders of the Parent (GH¢000) Non-controlling Interests’ Equity (GH¢000) Total Equity (GH¢000)
2024
Balances b/d 457,200 65,600 522,800
Total comprehensive income 190,800 35,300 226,100
Dividends (110,000) (8,700) (118,700)
Balances c/d 538,000 92,200 630,200
2023
Balances b/d 355,000 46,650 401,650
Total comprehensive income 160,500 26,400 186,900
Dividends (58,300) (7,450) (65,750)
Balances c/d 457,200 65,600 522,800

Summarised Statement of Financial Position as at 30 June 2024

2024 (GH¢000) 2023 (GH¢000)
Non-current assets
Property, plant, and equipment 718,000 657,000
Others 156,000 99,000
Total Non-current assets 874,000 756,000
Current assets
Trade receivables 140,000 121,000
Others 236,500 123,050
Total Current assets 376,500 244,050
Total Assets 1,250,500 1,000,050
Total Equity and Liability 1,250,500 1,000,050

Additional information:

  1. The total number of equity shares outstanding was 1.2 million and 1.4 million at 30 June 2023 and 30 June 2024 respectively.
  2. Other comprehensive income attributable to non-controlling interests for the years ended 30 June 2023 and 2024 amounted to GH¢8.05 million and GH¢9.6 million respectively.
  3. Non-current liabilities at 30 June 2023 and 30 June 2024 amounted to GH¢250,800 and GH¢308,510 respectively.
  4. The following metrics have been gleaned from NK’s published sustainability reports across the two years:
Metric 2024 2023
Scope 1 & 2 carbon emissions (tonnes of CO2) 650 780
Scope 3 carbon emissions (tonnes of CO2) 2,400 2,380
Women in senior management (%) 21 16
Total recordable injury frequency rate (TRIFR) per 100 full-time workers 3.3 4.1

The scope and definitions of the above sustainability measures have remained materially unchanged across the two years.

Required:

Compute the following ratios for the years ended 2024 & 2023:

  1. Operating profit margin
  2. Return on parent’s equity
  3. Earnings per share
  4. Current ratio
  5. Trade receivables days
  6. Total liabilities to total assets %

Login or create a free account to see answers

Find Related Questions by Tags, levels, etc.

Report an error

You're reporting an error for "CR – Nov 2024 – L3 – Q5a – Financial Analysis and Investment Evaluation"

FR – Nov 2024 – L2 – Q4b – Financial Performance Assessment of Acquisition Targets

Assessment of financial performance and position of Suah LTD and Nagbe LTD to assist Dukuly LTD in an acquisition decision.

Dukuly LTD, a public entity, has been expanding through acquisitions. It is assessing two potential acquisition targets, Suah LTD and Nagbe LTD, both operating in the same industry.

The financial statements of Suah LTD and Nagbe LTD for the year ended 30 September 2024 have been provided, along with a set of financial ratios calculated for Suah LTD.

Required:
Using the calculated ratios for Nagbe LTD from Question 4a, assess the relative financial performance and financial position of Suah LTD and Nagbe LTD, to assist the directors of Dukuly LTD in making an acquisition decision.

Login or create a free account to see answers

Find Related Questions by Tags, levels, etc.

Report an error

You're reporting an error for "FR – Nov 2024 – L2 – Q4b – Financial Performance Assessment of Acquisition Targets"

FR – Nov 2024 – L2 – Q4a – Financial Ratios and Performance Evaluation

Calculation of key financial ratios for Nagbe LTD to compare with Suah LTD and evaluate financial performance.

Dukuly LTD, a public entity, has been expanding through acquisitions. It is assessing two potential acquisition targets, Suah LTD and Nagbe LTD, which operate in the same industry. The indicative price for acquiring either entity is GH¢12 million.

The financial statements for Suah LTD and Nagbe LTD are provided as follows:

Statement of Profit or Loss for the year ended 30 September 2024

Item Suah LTD (GH¢’000) Nagbe LTD (GH¢’000)
Revenue 25,000 40,000
Cost of Sales (19,000) (32,800)
Gross Profit 6,000 7,200
Distribution & Admin Expenses (1,250) (2,300)
Finance Costs (250) (900)
Profit Before Tax 4,500 4,000
Income Tax Expense (900) (1,000)
Profit for the Year 3,600 3,000

Statement of Financial Position as at 30 September 2024

Item Suah LTD (GH¢’000) Nagbe LTD (GH¢’000)
Non-Current Assets 4,800 10,300
Current Assets 4,800 8,700
Total Assets 9,600 19,000
Equity 2,600 5,600
Non-Current Liabilities 5,000 9,200
Current Liabilities 2,000 4,200
Total Equity & Liabilities 9,600 19,000

Additional Information:

  1. Carrying Amount of Plant Assets:

    • Suah LTD: GH¢4,800,000
    • Nagbe LTD: GH¢2,000,000
  2. The following ratios for Suah LTD are provided:

    Ratio Suah LTD
    Return on Capital Employed (ROCE) 62.5%
    Net Asset Turnover 3.3 times
    Gross Profit Margin 24.0%
    Profit Margin (Before Interest & Tax) 19.0%
    Current Ratio 2.4:1
    Inventory Holding Period 31 days
    Trade Receivables Collection Period 31 days
    Trade Payables Payment Period 24 days
    Gearing Ratio 65.80%
    Acid Test Ratio 1.6:1

Required:
Using the financial statements provided, calculate the corresponding ratios for Nagbe LTD to compare with Suah LTD.

Login or create a free account to see answers

Find Related Questions by Tags, levels, etc.

Report an error

You're reporting an error for "FR – Nov 2024 – L2 – Q4a – Financial Ratios and Performance Evaluation"

CR – May 2015 – L3 – Q3 – Emerging Trends in Corporate Reporting

Analyze financial statements of two companies and discuss limitations of ratio analysis.

Real Expansion Plc is a large group that seeks to grow by acquisition. The directors have identified two potential entities and obtained copies of their financial statements. The accountant of the company computed key ratios to evaluate the performance of these companies relating to:

  • Profitability and returns;
  • Efficiency in the use of assets;
  • Corporate leverage; and
  • Investor-based decisions.

The computation generated hot arguments among the directors, and they decided to engage a Consultant to provide expert advice on which company to acquire.

Extracts from these financial statements are given below:

Required:

(a) As the Consultant to the company, carry out a financial analysis on the financial statements and advise the company appropriately. (15 Marks)

(b) State the major limitations of ratio analysis for performance evaluation. (5 Marks)

Login or create a free account to see answers

Find Related Questions by Tags, levels, etc.

Report an error

You're reporting an error for "CR – May 2015 – L3 – Q3 – Emerging Trends in Corporate Reporting"

CR – May 2016 – L3 – Q2 – Introduction to Corporate Reporting

Analyze Ehis Marvel Plc's financial performance and assess clothing and food sales divisions' contributions.

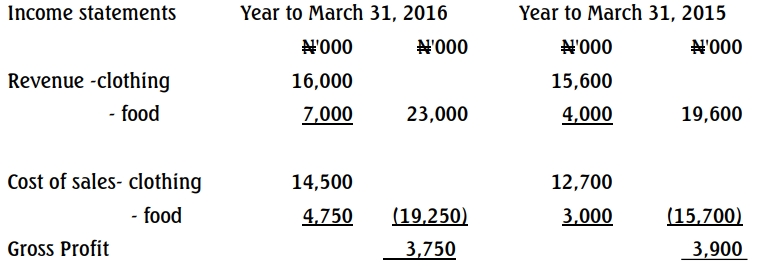
Ehis Marvel, a public company, is a high street retailer that sells clothing and food. The managing director is very disappointed with the current year’s result. The company expanded its operations and commissioned a famous designer to restyle its clothing products. This has led to increased sales in both retail lines, yet overall profits are down.

Extract from the Income Statement for the two years to March 31, 2016, are shown:

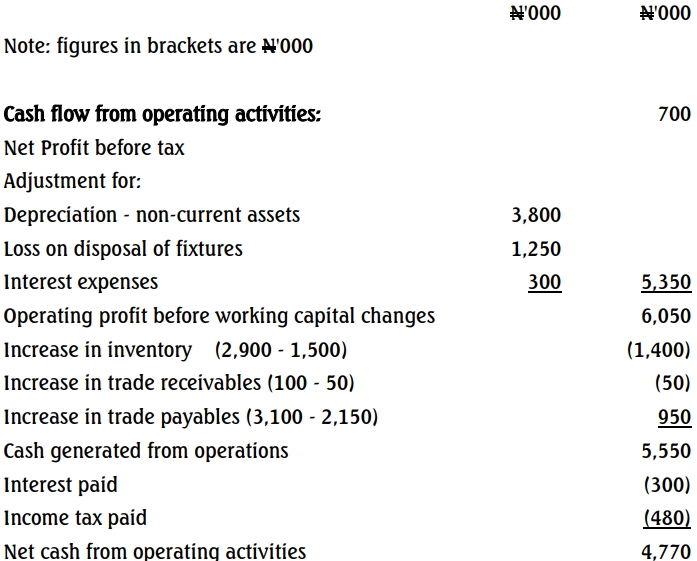
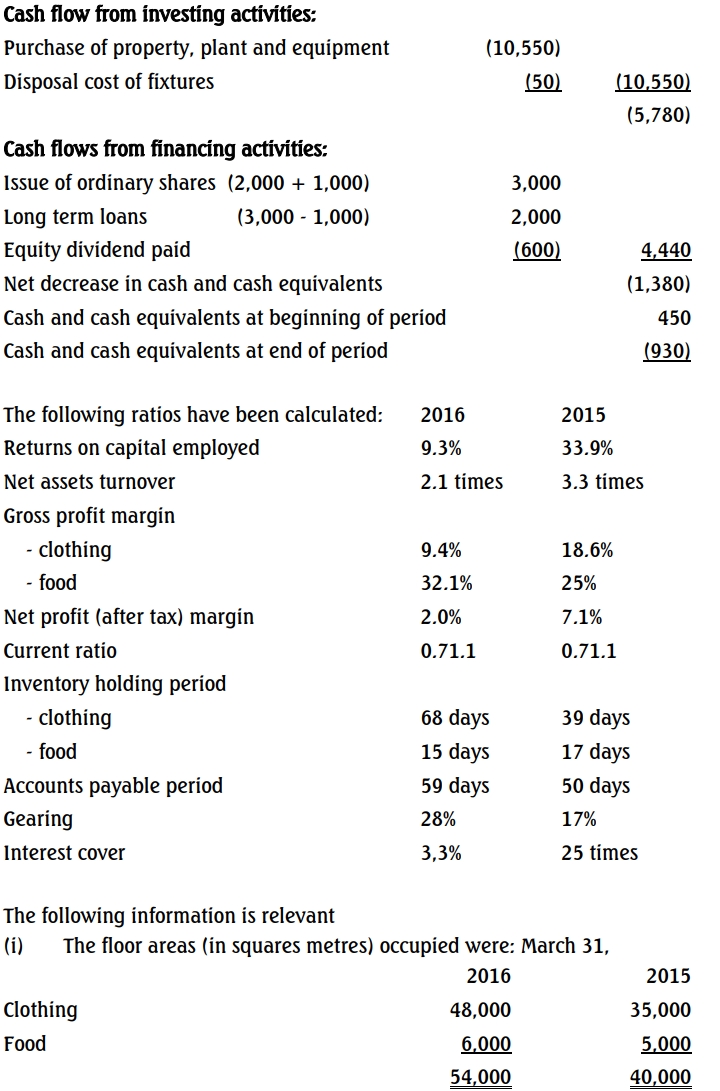
Ehis Marvel Plc – Statement of cash flow for the year to March 31, 2016

(ii) The share price of Ehis Marvel Plc averaged N6.00 during the year to March 31, 2015, but was only N3.00 at March 31, 2016.

Required:
Write a report analysing the financials of Ehis Marvel Plc, utilising the above ratios and the information in the statement of cash flows for the two years ended March 31, 2016. Your report should refer to the relative performance of the clothing and food sales and be supported by any further ratios you consider appropriate.

Login or create a free account to see answers

Find Related Questions by Tags, levels, etc.

Report an error

You're reporting an error for "CR – May 2016 – L3 – Q2 – Introduction to Corporate Reporting"

CR – May 2019 – L3 – Q2 – Accounting Policies, Changes in Accounting Estimates, and Errors (IAS 8)

Assess the accounting treatment of a policy change and analyze the profitability, liquidity, and efficiency ratios of the company based on the financial statements.

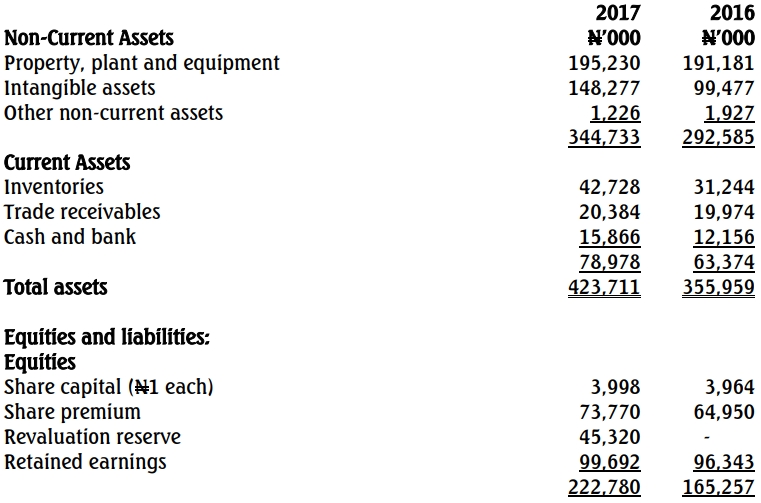
Below is the draft financial statement of Lanwani Plc., a manufacturer of fast-moving consumer goods.

Statement of financial position as at

Statement of profit or loss

Additional Information:

  1. The company changed its accounting policy from the cost model to the revaluation model for its property. The revaluation reserve represents the revaluation surplus recognized in 2017. No adjustment was made for 2016.
  2. Development costs of ₦45 billion were capitalized during 2017. The related asset is not expected to generate economic benefits until 2020.

Required:
a. Assess the accounting treatment of the change in accounting policy and state the impact on the return on capital employed (ROCE). (3 Marks)
b. Analyze the profitability, liquidity, and efficiency of Lanwani Plc. (15 Marks)
c. Briefly discuss TWO limitations of the analysis done in (b) above. (2 Marks)

Login or create a free account to see answers

Find Related Questions by Tags, levels, etc.

Report an error

You're reporting an error for "CR – May 2019 – L3 – Q2 – Accounting Policies, Changes in Accounting Estimates, and Errors (IAS 8)"

CR – Nov 2014 – L3 – SC – Q6b – Introduction to Corporate Reporting

Evaluate Luck & Co's financial position and recommend restructuring options to address going concern threats.

Scenario:
Luck & Co. has been making losses over the last few years. Its statement of financial position at 31 December, 2013, showed the following:

Statement of Financial Position as at 31 December, 2013

Assets N
Property, plant, and equipment 80,000
Inventory 20,000
Receivables 40,000
Total Assets 140,000
Equity and Liabilities N
Ordinary Capital 100,000
Retained Earnings (140,000)
Secured Loan Stock 100,000
Payables 80,000
Total Equity & Liabilities 140,000

On liquidation, the assets would realise the following:

Assets N
Property, plant, and equipment 30,000
Inventory 12,000
Receivables 36,000
Total Realisable Value 78,000

If the company continues to trade for the next four years, profit after charging N20,000 per annum as depreciation on the property, plant and equipment would be as follows:

Year Profit (N)
2014 4,000
2015 20,000
2016 26,000
2017 28,000
Total 78,000

Assume that there would be no surplus cash to settle the payables and loan stock holders until after four years when inventory and receivables could be realised at their book values.

Required:

Evaluate the financials and advise the management of Luck & Co on the options available to them and redraft the statement of financial position of Luck & Co after the exercise. (9 Marks)

Login or create a free account to see answers

Find Related Questions by Tags, levels, etc.

Report an error

You're reporting an error for "CR – Nov 2014 – L3 – SC – Q6b – Introduction to Corporate Reporting"

FM – Nov 2016 – L3 – Q6 – Strategic Performance Measurement

Evaluate Osamco Limited's financial performance and discuss reasons for its potential stock exchange listing.

Osamco Limited, a manufacturer of wire and cables, was bought from its conglomerate parent company in a management buyout deal in August 2010. Six years later, the managers are considering the possibility of listing the company’s shares on the Nigerian Stock Exchange.

The following financial information is made available:

OSAMCO LIMITED
Income Statement for the Year Ended June 30, 2016

Item Amount (N’million)
Turnover 91.25
Cost of sales (79.00)
Profit before interest and taxation 12.25
Interest (3.25)
Profit before taxation 9.00
Taxation (1.25)
Profit attributable to ordinary shareholders 7.75
Dividend (0.75)
Retained profit 7.00

Statement of Financial Position as at June 30, 2016

Average performance ratios for the industry sector in which Osamco Limited operates are as stated below:

Industry Sector Ratios

Ratio Industry Average
Return before interest and tax on long-term capital employed 24%
Return after tax on equity 16%
Operating profit as a percentage of sales 11%
Current ratio 1.6:1
Quick (acid test) ratio 1.0:1
Total debt: equity (gearing) 24%
Dividend cover 4.0
Interest cover 4.5

Required:

  1. (a) Evaluate the financial state and performance of Osamco Limited by comparing it with that of its industry sector. (10 Marks)
  2. (b) Discuss four probable reasons why the management of Osamco Limited is considering Stock Exchange listing. (5 Marks)

Login or create a free account to see answers

Find Related Questions by Tags, levels, etc.

Report an error

You're reporting an error for "FM – Nov 2016 – L3 – Q6 – Strategic Performance Measurement"

CR – May 2018 – L3 – SB – Q4a – Presentation of Financial Statements (IAS 1)

Explain how off-statement financing can mislead financial statement users, with examples for three user groups.

a. Recording the substance of transactions, rather than their legal form, is an important principle in financial reporting. The use of off-statement of financial position financing arrangement enables companies to obtain financing without showing debts in their books.

Required:

Describe how the use of off-statement of financial position financing can mislead users of financial statements, making specific reference to THREE user groups and giving examples where recording the legal form of transactions may mislead them. (6 Marks)

Login or create a free account to see answers

Find Related Questions by Tags, levels, etc.

Report an error

You're reporting an error for "CR – May 2018 – L3 – SB – Q4a – Presentation of Financial Statements (IAS 1)"

PM – May 2015 – L2 – SB – Q6 – Costing Systems and Techniques-

Determine the most profitable product mix for Markus Limited, and prepare a profitability statement for the optimal product mix.

Markus Limited manufactures three products and operates a marginal costing system.

The following information has been extracted from the company’s records:

Products X Y Z
Units budgeted to be produced and sold 3,600 6,000 3,400
Selling Price (₦) 120 110 100
Requirement per Unit:
Direct Material (kg) 5 3 4
Direct Labour (Hours) 4 3 2
Direct Labour Hour rate (₦) 4 4 4
Direct Material Cost per Kg (₦) 8 8 8
Variable Overheads (₦) 14 26 16
Fixed Overheads (₦) 20 20 20
Maximum possible sales (units) 8,000 10,000 3,000

All the three products are produced from the same direct material using the same types of machine and labour. Direct labour, which is the key factor, is limited to 37,200 hours.

Required: a. Determine the most profitable product mix. (6 Marks)
b. Prepare a statement of profitability for the product mix. (9 Marks)

Login or create a free account to see answers

Find Related Questions by Tags, levels, etc.

Report an error

You're reporting an error for "PM – May 2015 – L2 – SB – Q6 – Costing Systems and Techniques-"

MI – May 2017 – L1 – SA – Q11 – Cost-Volume-Profit (CVP) Analysis

Identify the definition of Margin of Safety in value.

The margin of safety in value is expected to be:
A. Sales less profit at break-even point
B. Sales less cost at break-even point
C. Cost less cost at break-even point
D. Sales less sales at break-even point
E. Profit less profit at break-even point

Login or create a free account to see answers

Find Related Questions by Tags, levels, etc.

Report an error

You're reporting an error for "MI – May 2017 – L1 – SA – Q11 – Cost-Volume-Profit (CVP) Analysis"

FR – March 2023 – L2 – Q4 – Financial Statement Analysis

Analyze and compare the financial performance of Boomu Ltd and Sintim Ltd using profitability, liquidity, efficiency, and gearing ratios.

Boomu Ltd is an agro-processing company with strong competition from Sintim Ltd. The Board of Directors of Boomu Ltd wants to measure the performance of the company against its competitor. Below are the statement of comprehensive income of the two companies for the year ended 31 December 2021, and the statement of financial positions as at that date.

Statement of Comprehensive Income:

Boomu Ltd (GH¢000) Sintim Ltd (GH¢000)
Revenue 619,085 956,200
Cost of Sales (424,700) (762,400)
Gross Profit 194,385 193,800
Administrative Expenses (58,635) (84,940)
Other Income 6,335 9,270
Operating Profit 142,085 118,130
Finance Cost (3,000)
Profit Before Income Tax 142,085 115,130
Income Tax Expense (23,460) (34,220)
Profit for the Year 118,625 80,910

Statement of Financial Position:

Boomu Ltd (GH¢000) Sintim Ltd (GH¢000)
Non-Current Assets
Property, Plant & Equipment 231,636 197,884
Intangible Assets 105,320 111,928
Total Non-Current Assets 336,956 309,812
Current Assets
Inventories 33,960 37,480
Trade Receivables 26,216 3,836
Cash and Cash Equivalents 91,328 42,472
Total Current Assets 151,504 83,788
Total Assets 488,460 393,600

Equity & Liabilities:

Boomu Ltd (GH¢000) Sintim Ltd (GH¢000)
Equity
Share Capital 20,000 30,000
Retained Earnings 390,536 283,820
Total Equity 410,536 313,820
Non-Current Liabilities
Deferred Taxation 18,120 13,948
20% Loan Notes 30,000
Total Non-Current Liabilities 18,120 43,948
Current Liabilities
Trade and Other Payables 42,904 28,040
Current Tax 16,900 7,792
Total Current Liabilities 59,804 35,832
Total Equity & Liabilities 488,460 393,600

Required: As the Finance Manager of the company, write a report to the Board of Directors, assessing the comparative performance of the company for the year ended 31 December 2021 using THREE (3) profitability ratios, TWO (2) liquidity ratios, THREE (3) efficiency ratios, and TWO (2) gearing ratios.

Login or create a free account to see answers

Find Related Questions by Tags, levels, etc.

Report an error

You're reporting an error for "FR – March 2023 – L2 – Q4 – Financial Statement Analysis"

MI – May 2016 – L1 – SB – Q3 – Cost-Volume-Profit (CVP) Analysis

Perform various CVP calculations including break-even point, profit, margin of safety, and contribution for a product.

HEALTH-GRACE limited produces one standard product called Bambino Syrup which sells at ₦20.00 per bottle. The trading results for the six months ended June 30, 2015 were as follows:

Month Sales (Units) Profit / Loss (₦)
January 120,000 80,000
February 140,000 120,000
March 60,000 (40,000)
April 96,000 32,000
May 104,000 24,000
June 72,000 16,000

From the above information, you are required to calculate the following:

a. Break-even point in units and Naira value. (2 Marks)
b. Fixed cost. (2 Marks)
c. Variable cost per unit. (8 Marks)
d. Profit volume ratio. (2 Marks)
e. Contribution, assuming 70,000 bottles are sold. (2 Marks)
f. Margin of safety assuming 90,000 bottles are sold. (1 Mark)
g. The number of bottles to be sold to generate a profit after tax of ₦70,000 assuming the tax rate is 30%. (3 Marks)

Login or create a free account to see answers

Find Related Questions by Tags, levels, etc.

Report an error

You're reporting an error for "MI – May 2016 – L1 – SB – Q3 – Cost-Volume-Profit (CVP) Analysis"

FR – Nov 2023 – L2 – Q4b – Financial Statement Analysis

Write a report analyzing the performance of two companies, Addin Petroleum and Gyan Petroleum, using key financial ratios.

Write a report to the Chairperson of the board based on a comparative analysis of the performance of both companies using the ratios computed in (a) above.

Login or create a free account to see answers

Find Related Questions by Tags, levels, etc.

Report an error

You're reporting an error for "FR – Nov 2023 – L2 – Q4b – Financial Statement Analysis"

FR – July 2023 – L2 – Q4 – Performance Analysis

Assess the financial performance of Besease Ltd using financial ratios and prepare a report for the board of directors.

Besease Ltd won two prestigious awards in 2020 despite the negative impact of the COVID-19 pandemic. The Board of Directors seeks to assess the company’s performance for the year ended 31 December 2021 in comparison to 2020.

Below are the financial statements for the year ended 31 December 2021:

Statement of comprehensive income for the year ended 31 December

2021 (GH¢) 2020 (GH¢)
Revenue 7,315,927 6,184,754
Cost of sales (4,322,986) (3,441,339)
Gross profit 2,992,941 2,743,415
Other income 330,812 280,832
Administrative expenses (2,511,179) (2,648,987)
Operating profit 812,574 375,260
Finance cost (496,913) (174,872)
Profit before tax 315,661 200,388
Taxation (188,621) (30,700)
Profit for the year 127,040 169,688

Statement of financial position as at 31 December

2021 (GH¢) 2020 (GH¢)
Non-current assets
Property, Plant & Equipment 9,224,988 5,102,799
Intangible assets 35,824 33,350
Investments 36,629 36,629
Total non-current assets 9,297,441 5,172,778
Current assets
Inventories 2,878,337 1,329,279
Trade receivables 1,875,594 2,246,747
Cash and bank balances 527,412 372,081
Total current assets 5,281,343 3,948,107
Total assets 14,578,784 9,120,885
Equity & Liabilities
Equity
Share capital 217,467 217,467
Retained earnings 1,289,140 1,162,100
Credit reserve 826,528 1,102,037
Total equity 2,333,135 2,481,604
Non-current liabilities
Interest-bearing loans 6,708,598 2,800,223
Deferred taxation 187,624 186,304
Total non-current liabilities 6,896,222 2,986,527
Current liabilities
Trade payables 1,257,693 1,550,466
Taxation 118,337 101,391
Other payables 2,993,667 1,021,167
Accrued expenses 979,730 979,730
Total current liabilities 5,349,427 3,652,754
Total equity & liabilities 14,578,784 9,120,885

The Finance Manager has selected the following performance ratios:
i) Return on capital employed (capital employed = interest-bearing debt + shareholders’ equity) (%)
ii) Return on equity (%)
iii) Acid test ratio (times)
iv) Debt-to-equity ratio
v) Interest cover ratio (times)

Required:
Write a report to the Board of Directors assessing the comparative performance of Besease Ltd for the year ended 31 December 2021 using the given ratios.

Login or create a free account to see answers

Find Related Questions by Tags, levels, etc.

Report an error

You're reporting an error for "FR – July 2023 – L2 – Q4 – Performance Analysis"

FR – May 2017 – L2 – Q4b – Financial Statement Analysis

Write a report analyzing the performance of Shine Ltd compared to Diamond Ltd and the industry averages based on profitability, liquidity, gearing, and efficiency.

As the Financial Controller of Shine Ltd, write a report to the Managing Director analyzing the performance of your company, comparing the results against that of Diamond Ltd (a key competitor) and against the industry average using the following measures:

  • Profitability
  • Liquidity
  • Gearing
  • Efficiency

Login or create a free account to see answers

Find Related Questions by Tags, levels, etc.

Report an error

You're reporting an error for "FR – May 2017 – L2 – Q4b – Financial Statement Analysis"

FR – May 2017 – L2 – Q4a – Financial Statement Analysis

Calculate comparable financial ratios for Diamond Ltd and Shine Ltd based on profitability, liquidity, gearing, and efficiency.

The following information has been extracted from the recently published accounts of Diamond Ltd and Shine Ltd.

Statement of Profit or Loss for the year ended 31 December 2016

The following are the latest industry average ratios:
Required:
Calculate comparable ratios (to two decimal places where appropriate) for the two companies. All calculations must be clearly shown.

Login or create a free account to see answers

Find Related Questions by Tags, levels, etc.

Report an error

You're reporting an error for "FR – May 2017 – L2 – Q4a – Financial Statement Analysis"

FR – Nov 2016 – L2 – Q4a – Financial Statement Analysis

Analyze the financial performance and financial position of Ashtown Ltd based on industry ratios for the years 2014 and 2015.

You are a private consultant for Ashtown Ltd, a listed company in Ghana operating in the manufacturing sector. Below is a Statement of Financial Position and a summarized statement of changes in equity with comparatives for the year ended 31 December 2015.

Statement of Financial Position as at 31 December 2015:

Required:
Prepare a report and address it to the Chief Executive Officer, analyzing the financial performance and financial position of Ashtown Ltd based on the industry ratios above for the years 2014 and 2015.

Login or create a free account to see answers

Find Related Questions by Tags, levels, etc.

Report an error

You're reporting an error for "FR – Nov 2016 – L2 – Q4a – Financial Statement Analysis"

FR – May 2018 – L2 – Q4 – Financial Statement Analysis

Calculate financial ratios for Obiya Ltd based on its financial statements for the year ended 30 September 2017.

Obiya Ltd assembles computer equipment from bought-in components and distributes them to various wholesalers and retailers. It has recently subscribed to an inter-firm comparison service. Members submit accounting ratios as specified by the operator of the service, and in return, members receive the average figures for each of the specified ratios taken from all of the companies in the same sector that subscribe to the service. The specified ratios and the average figures for Obiya’s sector are shown below:

Ratios of sector companies for the period to 30 September 2017

Ratio Sector Average
Return on capital employed 22.1%
Net asset turnover 1.8 times
Gross profit margin 30%
Net profit (before tax) margin 12.50%
Current ratio 1.6:1
Quick ratio 0.9:1
Inventory holding period 46 days
Accounts receivable collection period 45 days
Accounts payable payment period 55 days
Debt to equity 40%
Dividend yield 6%
Dividend cover 3 times

Obiya Ltd’s financial statements for the year to 30 September 2017 are set out below:

Statement of profit or loss for the year ended 30 September 2017

Description GH¢’000
Revenue 2,425
Cost of sales (1,870)
Gross profit 555
Other operating expenses (215)
Operating profit 340
Finance costs (34)
Exceptional item (note ii) (120)
Profit before tax 186
Income tax (90)
Profit for the period 96

Statement of changes in equity (extract)
For the year ended 30 September 2017

Description GH¢’000
Retained earnings – 1 October 2016 179
Net profit for the period 96
Dividends paid (Interim GH¢60,000; final GH¢30,000) (90)
Retained earnings – 30 September 2017 185

Statement of financial position as at 30 September 2017

Description GH¢’000
Non-current assets
Property, plant, equipment 540
Current assets
Inventory 275
Accounts receivable 320
Bank
Total current assets 595
Total assets 1,135
Equity
Ordinary shares (25 pesewas each) 150
Retained earnings 185
Total equity 335
Non-current liabilities
8% loan notes 300
Current liabilities
Bank overdraft 65
Trade accounts payable 350
Taxation 85
Total current liabilities 500
Total equity and liabilities 1,135

Notes:

i) The details of the non-current assets are:

Description Cost (GH¢’000) Accumulated depreciation (GH¢’000) Net book value (GH¢’000)
At 30 September 2017 3,600 3,060 540

ii) The exceptional item relates to losses on the sale of a batch of computers that had become worthless due to improvements in microchip design.

iii) The market price of Obiya’s shares throughout the year averaged GH¢6.00 each.

Required:
a) Calculate the ratios for Obiya equivalent to those provided by the inter-firm comparison service.

(5 marks)

b) Write a report analyzing the operational performance, gearing, investment, and liquidity of Obiya Ltd based on a comparison with the sector averages. (10 marks)

Login or create a free account to see answers

Find Related Questions by Tags, levels, etc.

Report an error

You're reporting an error for "FR – May 2018 – L2 – Q4 – Financial Statement Analysis"

FR – Nov 2018 – L2 – Q4 – Financial Statement Analysis

Assess the financial performance and position of Light Ltd and Favour Ltd for acquisition purposes based on profitability, liquidity, and gearing ratios.

Salt Ltd is a Government Business Entity that would like to acquire 100% of a viable private company. It has obtained the following draft financial statements for two companies, Light Ltd and Favour Ltd. They operate in the same industry, and their managements have indicated they would be receptive to a takeover.

Statement of Profit or Loss for the year ended 31 December 2017:

Description Light Ltd (GH¢’000) Favour Ltd (GH¢’000)
Revenue 12,000 20,500
Cost of sales (10,500) (18,000)
Gross profit 1,500 2,500
Operating expenses (240) (500)
Finance costs (210) (600)
Profit before tax 1,050 1,400
Income tax expense (150) (400)
Profit for the year 900 1,000
Dividends paid 250 700

Statements of Financial Position as at 31 December 2017:

Description Light Ltd (GH¢’000) Favour Ltd (GH¢’000)
Assets
Non-current assets:
Freehold factory 4,400
Owned plant 5,000 2,200
Leased plant 5,300
Total non-current assets 9,400 7,500
Current assets:
Inventory 2,000 3,600
Trade receivables 2,400 3,700
Bank 600
Total current assets 5,000 7,300
Total assets 14,400 14,800
Equity and Liabilities
Equity shares of GH¢1 each 2,000 2,000
Property revaluation reserve 900
Retained earnings 2,600 800
Total equity 5,500 2,800
Non-current liabilities
Finance lease obligations 3,200
7% loan notes 3,000
10% loan notes 3,000
Deferred tax 600 100
Government grants 1,200
Total non-current liabilities 4,800 6,300
Current liabilities
Bank overdraft 1,200
Trade payables 3,100 3,800
Government grants 400
Finance lease obligations 500
Taxation 600 200
Total current liabilities 4,100 5,700
Total equity and liabilities 14,400 14,800

Notes:

i. Both companies operate from the same premises.
ii. Additional details of the two companies’ plant are:

Description Light Ltd (GH¢’000) Favour Ltd (GH¢’000)
Owned plant – Historical cost 8,000 10,000
Leased plant – Original fair value 7,500

There were no disposals of plant during the year by either company.

iii. The interest rate implicit within Favour Ltd’s finance leases is 7.5% per annum. For the purpose of calculating ROCE and gearing, all finance lease obligations are treated as long-term interest-bearing borrowings.

Required:
Assess the relative financial performance and financial position of Light Ltd and Favour Ltd for the year ended 31 December 2017 to inform the directors of Salt Ltd in their acquisition decision. Your analysis should focus on profitability, liquidity, and gearing.
(15 marks)

Login or create a free account to see answers

Find Related Questions by Tags, levels, etc.

Report an error

You're reporting an error for "FR – Nov 2018 – L2 – Q4 – Financial Statement Analysis"

Oops!

This feature is only available in selected plans.

Click on the login button below to login if you’re already subscribed to a plan or click on the upgrade button below to upgrade your current plan.

If you’re not subscribed to a plan, click on the button below to choose a plan