Question Tag: Liquidity

Search 500 + past questions and counting.
  • Filter by Professional Bodies

  • Filter by Subject

  • Filter by Series

  • Filter by Topics

  • Filter by Levels

CR – Nov 2024 – L3 – Q5a – Financial Analysis and Investment Evaluation

Compute financial ratios for Nsawkaw PLC to evaluate its financial performance for investment recommendation.

Nsawkaw PLC (NK), a gold processing and trading company, has been identified by Djaraye Private Equity Fund (DPEF) as a target for long-term equity investment. As a financial consultant of DPEF, you have been tasked to evaluate the integrated financial condition of NK and make an investment recommendation.

Below are the summarised versions of NK’s Consolidated Financial Statements for the year ended June 30, 2024 (together with its comparative period):

Summarised Consolidated Statement of Profit or Loss for the year ended 30 June 2024

2024 (GH¢000) 2023 (GH¢000)
Revenue 2,538,000 2,125,000
Operational expenses (1,909,100) (1,592,900)
Interest costs (186,700) (157,250)
Taxation (234,000) (198,500)
Profit after tax 208,200 176,350
Other comprehensive income 17,900 10,550
Total comprehensive income 226,100 186,900

Summarised Consolidated Statement of Changes in Equity for the year ended 30 June 2024

Equity Holders of the Parent (GH¢000) Non-controlling Interests’ Equity (GH¢000) Total Equity (GH¢000)
2024
Balances b/d 457,200 65,600 522,800
Total comprehensive income 190,800 35,300 226,100
Dividends (110,000) (8,700) (118,700)
Balances c/d 538,000 92,200 630,200
2023
Balances b/d 355,000 46,650 401,650
Total comprehensive income 160,500 26,400 186,900
Dividends (58,300) (7,450) (65,750)
Balances c/d 457,200 65,600 522,800

Summarised Statement of Financial Position as at 30 June 2024

2024 (GH¢000) 2023 (GH¢000)
Non-current assets
Property, plant, and equipment 718,000 657,000
Others 156,000 99,000
Total Non-current assets 874,000 756,000
Current assets
Trade receivables 140,000 121,000
Others 236,500 123,050
Total Current assets 376,500 244,050
Total Assets 1,250,500 1,000,050
Total Equity and Liability 1,250,500 1,000,050

Additional information:

  1. The total number of equity shares outstanding was 1.2 million and 1.4 million at 30 June 2023 and 30 June 2024 respectively.
  2. Other comprehensive income attributable to non-controlling interests for the years ended 30 June 2023 and 2024 amounted to GH¢8.05 million and GH¢9.6 million respectively.
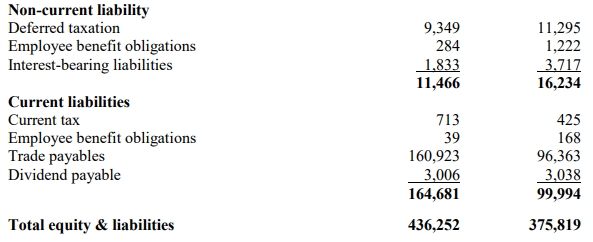
  3. Non-current liabilities at 30 June 2023 and 30 June 2024 amounted to GH¢250,800 and GH¢308,510 respectively.
  4. The following metrics have been gleaned from NK’s published sustainability reports across the two years:
Metric 2024 2023
Scope 1 & 2 carbon emissions (tonnes of CO2) 650 780
Scope 3 carbon emissions (tonnes of CO2) 2,400 2,380
Women in senior management (%) 21 16
Total recordable injury frequency rate (TRIFR) per 100 full-time workers 3.3 4.1

The scope and definitions of the above sustainability measures have remained materially unchanged across the two years.

Required:

Compute the following ratios for the years ended 2024 & 2023:

  1. Operating profit margin
  2. Return on parent’s equity
  3. Earnings per share
  4. Current ratio
  5. Trade receivables days
  6. Total liabilities to total assets %

Login or create a free account to see answers

Find Related Questions by Tags, levels, etc.

Report an error

You're reporting an error for "CR – Nov 2024 – L3 – Q5a – Financial Analysis and Investment Evaluation"

PSAF – Nov 2024 – L2 – Q4a – Financial Ratio Analysis

Compute financial ratios for Ghana Wind Farms LTD to analyze performance trends.

Ghana Wind Farms LTD, a State-Owned Enterprise (SOE), has appointed a new Board of Directors in January 2023. The new Board, after settling for a year, is interested in assessing their performance for the year 2023 against the performance of the previous Board in the year 2022 through ratio analysis. Below is the financial statement of Ghana Wind Farms LTD for the two years.


Ghana Wind Farms LTD

Statement of Profit or Loss for the Year Ended 31 December 2023

2023 (GH¢) 2022 (GH¢)
Revenue 9,860,000 6,218,000
Direct Cost (5,905,000) (5,822,000)
Gross Profit 3,955,000 396,000
Distribution Costs (297,000) (264,000)
Administrative Expenses (505,000) (455,000)
Other Income 236,000 13,000
Other Gains 1,482,000
Operating Profit 3,389,000 1,172,000
Finance Cost (1,000,000) (334,000)
Profit Before Tax Expense 2,389,000 838,000
Tax Expense (500,000) (144,000)
Profit After Tax 1,889,000 694,000

Ghana Wind Farms LTD

Statement of Financial Position as at 31 December 2023

2023 (GH¢) 2022 (GH¢)
ASSETS
Non-Current Assets
Property, Plant & Equipment 17,000,000 15,000,000
Investment 5,000 2,000
Advances & Loans 30,000
Total Non-Current Assets 17,005,000 15,032,000
Current Assets
Inventories 687,000 546,000
Trade and Other Receivables 2,829,000 1,978,000
Prepayments 87,000 42,000
Cash and Cash Equivalents 383,000 434,000
Total Current Assets 3,986,000 3,000,000
TOTAL ASSETS 20,991,000 18,032,000
EQUITY & LIABILITIES
Equity
Government Equity 8,000 8,000
Other Government Equity 613,000 306,000
Capital Surplus 8,471,000 7,599,000
Income Surplus (1,434,000) 478,000
Total Equity 7,970,000 8,697,000
Non-Current Liabilities
Deferred Credit 6,692,000 670,000
Deferred Tax Liabilities 2,498,000 2,572,000
Borrowings (Due After One Year) 1,297,000 950,000
Total Non-Current Liabilities 10,487,000 4,192,000
Current Liabilities
Bank Overdraft 166,000 180,000
Provision for Company Tax 109,000 109,000
Trade and Other Payables 1,820,000 4,516,000
Borrowings (Due Within One Year) 439,000 338,000
Total Current Liabilities 2,534,000 5,143,000
Total Liabilities 13,021,000 9,335,000
TOTAL EQUITY AND LIABILITIES 20,991,000 18,032,000

Required:

a) Compute the following ratios:

i) Current Ratio
ii) Quick Ratio
iii) Inventory Turnover (Days)
iv) Trade Receivable Collection Period (Days)
v) Trade Payables Period (Days)
vi) Working Capital Cycle
vii) Interest Cover Ratio
viii) Total Debt – Total Asset Ratio

Login or create a free account to see answers

Find Related Questions by Tags, levels, etc.

Report an error

You're reporting an error for "PSAF – Nov 2024 – L2 – Q4a – Financial Ratio Analysis"

FR – Nov 2024 – L2 – Q4b – Financial Performance Assessment of Acquisition Targets

Assessment of financial performance and position of Suah LTD and Nagbe LTD to assist Dukuly LTD in an acquisition decision.

Dukuly LTD, a public entity, has been expanding through acquisitions. It is assessing two potential acquisition targets, Suah LTD and Nagbe LTD, both operating in the same industry.

The financial statements of Suah LTD and Nagbe LTD for the year ended 30 September 2024 have been provided, along with a set of financial ratios calculated for Suah LTD.

Required:
Using the calculated ratios for Nagbe LTD from Question 4a, assess the relative financial performance and financial position of Suah LTD and Nagbe LTD, to assist the directors of Dukuly LTD in making an acquisition decision.

Login or create a free account to see answers

Find Related Questions by Tags, levels, etc.

Report an error

You're reporting an error for "FR – Nov 2024 – L2 – Q4b – Financial Performance Assessment of Acquisition Targets"

FR – Nov 2024 – L2 – Q4a – Financial Ratios and Performance Evaluation

Calculation of key financial ratios for Nagbe LTD to compare with Suah LTD and evaluate financial performance.

Dukuly LTD, a public entity, has been expanding through acquisitions. It is assessing two potential acquisition targets, Suah LTD and Nagbe LTD, which operate in the same industry. The indicative price for acquiring either entity is GH¢12 million.

The financial statements for Suah LTD and Nagbe LTD are provided as follows:

Statement of Profit or Loss for the year ended 30 September 2024

Item Suah LTD (GH¢’000) Nagbe LTD (GH¢’000)
Revenue 25,000 40,000
Cost of Sales (19,000) (32,800)
Gross Profit 6,000 7,200
Distribution & Admin Expenses (1,250) (2,300)
Finance Costs (250) (900)
Profit Before Tax 4,500 4,000
Income Tax Expense (900) (1,000)
Profit for the Year 3,600 3,000

Statement of Financial Position as at 30 September 2024

Item Suah LTD (GH¢’000) Nagbe LTD (GH¢’000)
Non-Current Assets 4,800 10,300
Current Assets 4,800 8,700
Total Assets 9,600 19,000
Equity 2,600 5,600
Non-Current Liabilities 5,000 9,200
Current Liabilities 2,000 4,200
Total Equity & Liabilities 9,600 19,000

Additional Information:

  1. Carrying Amount of Plant Assets:

    • Suah LTD: GH¢4,800,000
    • Nagbe LTD: GH¢2,000,000
  2. The following ratios for Suah LTD are provided:

    Ratio Suah LTD
    Return on Capital Employed (ROCE) 62.5%
    Net Asset Turnover 3.3 times
    Gross Profit Margin 24.0%
    Profit Margin (Before Interest & Tax) 19.0%
    Current Ratio 2.4:1
    Inventory Holding Period 31 days
    Trade Receivables Collection Period 31 days
    Trade Payables Payment Period 24 days
    Gearing Ratio 65.80%
    Acid Test Ratio 1.6:1

Required:
Using the financial statements provided, calculate the corresponding ratios for Nagbe LTD to compare with Suah LTD.

Login or create a free account to see answers

Find Related Questions by Tags, levels, etc.

Report an error

You're reporting an error for "FR – Nov 2024 – L2 – Q4a – Financial Ratios and Performance Evaluation"

CR – May 2016 – L3 – Q2 – Introduction to Corporate Reporting

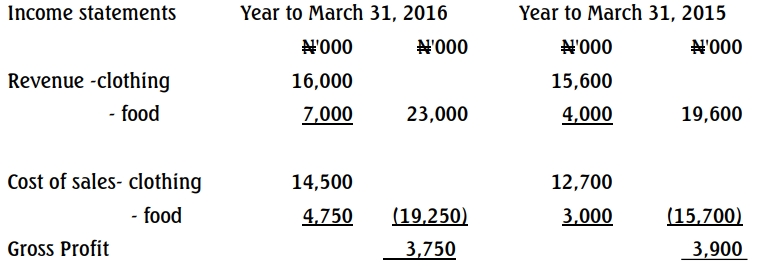
Analyze Ehis Marvel Plc's financial performance and assess clothing and food sales divisions' contributions.

Ehis Marvel, a public company, is a high street retailer that sells clothing and food. The managing director is very disappointed with the current year’s result. The company expanded its operations and commissioned a famous designer to restyle its clothing products. This has led to increased sales in both retail lines, yet overall profits are down.

Extract from the Income Statement for the two years to March 31, 2016, are shown:

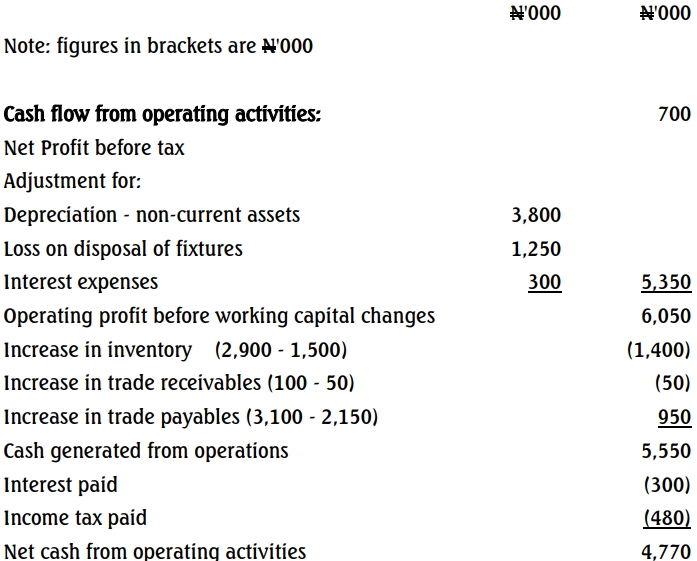
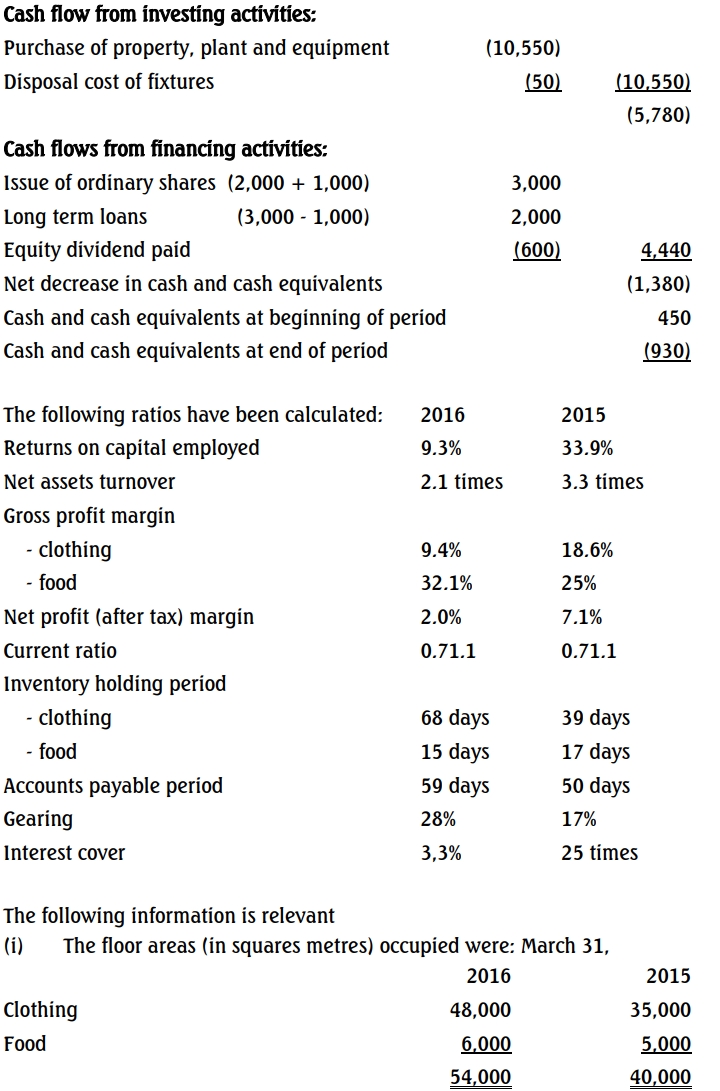
Ehis Marvel Plc – Statement of cash flow for the year to March 31, 2016

(ii) The share price of Ehis Marvel Plc averaged N6.00 during the year to March 31, 2015, but was only N3.00 at March 31, 2016.

Required:
Write a report analysing the financials of Ehis Marvel Plc, utilising the above ratios and the information in the statement of cash flows for the two years ended March 31, 2016. Your report should refer to the relative performance of the clothing and food sales and be supported by any further ratios you consider appropriate.

Login or create a free account to see answers

Find Related Questions by Tags, levels, etc.

Report an error

You're reporting an error for "CR – May 2016 – L3 – Q2 – Introduction to Corporate Reporting"

CR – May 2017 – L3 – Q7b – Integrated Reporting

Discuss the usefulness of cash flow statements and the potential benefits of integrated reporting.

The directors of Duranga Plc. have learned that corporate reporting could be improved by adopting the International Integrated Reporting Council’s Framework for Integrated Reporting. The directors believe that International Financial Reporting Standards (IFRS), which the company has recently adopted following the decision of the Federal Executive Council, are already extensive and provide stakeholders with a comprehensive understanding of its financial position and performance for the year. They believe that with over 100 countries adopting IFRS, their financial statements speak the international financial reporting language and practice. In particular, statements of cash flows, which the company prepares in accordance with IAS 7, enable stakeholders to assess the liquidity, solvency, and financial adaptability of a business. They are concerned that any additional disclosures could be excessive and obscure the most useful information within a set of financial statements. This is against the backdrop of a recent effort by the IASB on excessive disclosures in financial statements. They are therefore unsure of the rationale for the implementation of a separate or combined integrated report.

Required:
Discuss the extent to which statements of cash flow provide stakeholders with useful information about an entity and whether this information would be improved by the entity introducing an Integrated Report. (6 Marks)

Login or create a free account to see answers

Find Related Questions by Tags, levels, etc.

Report an error

You're reporting an error for "CR – May 2017 – L3 – Q7b – Integrated Reporting"

CR – May 2019 – L3 – Q2 – Accounting Policies, Changes in Accounting Estimates, and Errors (IAS 8)

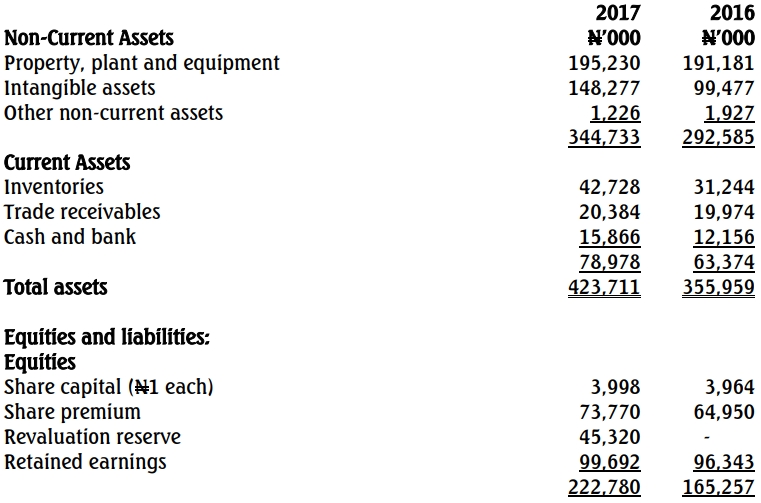
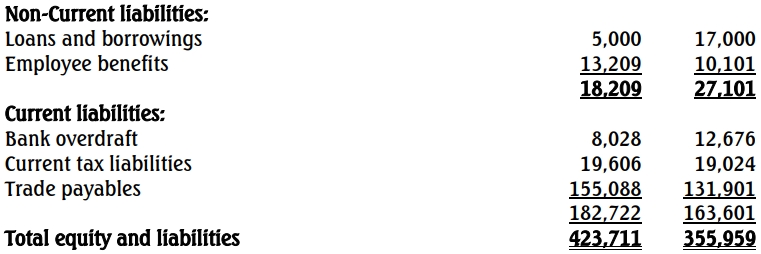
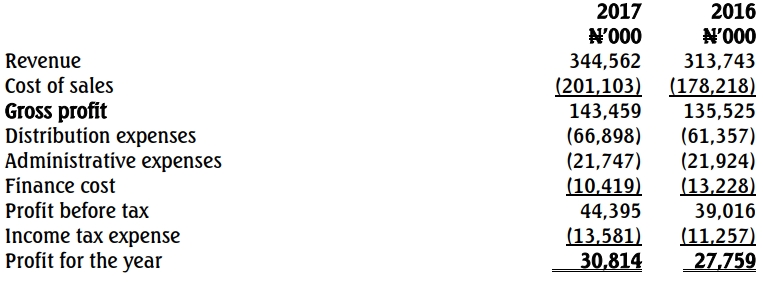
Assess the accounting treatment of a policy change and analyze the profitability, liquidity, and efficiency ratios of the company based on the financial statements.

Below is the draft financial statement of Lanwani Plc., a manufacturer of fast-moving consumer goods.

Statement of financial position as at

Statement of profit or loss

Additional Information:

  1. The company changed its accounting policy from the cost model to the revaluation model for its property. The revaluation reserve represents the revaluation surplus recognized in 2017. No adjustment was made for 2016.
  2. Development costs of ₦45 billion were capitalized during 2017. The related asset is not expected to generate economic benefits until 2020.

Required:
a. Assess the accounting treatment of the change in accounting policy and state the impact on the return on capital employed (ROCE). (3 Marks)
b. Analyze the profitability, liquidity, and efficiency of Lanwani Plc. (15 Marks)
c. Briefly discuss TWO limitations of the analysis done in (b) above. (2 Marks)

Login or create a free account to see answers

Find Related Questions by Tags, levels, etc.

Report an error

You're reporting an error for "CR – May 2019 – L3 – Q2 – Accounting Policies, Changes in Accounting Estimates, and Errors (IAS 8)"

AAA – Nov 2011 – L3 – SAII – Q17 – Review of Subsequent Events and Going Concern Assumptions

Definition of a company's inability to meet financial obligations on time.

The inability of a company to meet its financial obligations as and when due is called……………..

Login or create a free account to see answers

Find Related Questions by Tags, levels, etc.

Report an error

You're reporting an error for "AAA – Nov 2011 – L3 – SAII – Q17 – Review of Subsequent Events and Going Concern Assumptions"

CR – May 2018 – L3 – SB – Q4a – Presentation of Financial Statements (IAS 1)

Explain how off-statement financing can mislead financial statement users, with examples for three user groups.

a. Recording the substance of transactions, rather than their legal form, is an important principle in financial reporting. The use of off-statement of financial position financing arrangement enables companies to obtain financing without showing debts in their books.

Required:

Describe how the use of off-statement of financial position financing can mislead users of financial statements, making specific reference to THREE user groups and giving examples where recording the legal form of transactions may mislead them. (6 Marks)

Login or create a free account to see answers

Find Related Questions by Tags, levels, etc.

Report an error

You're reporting an error for "CR – May 2018 – L3 – SB – Q4a – Presentation of Financial Statements (IAS 1)"

FM – May 2015 – L2 – SB – Q2 – Introduction to Performance Management

Prepare profitability and cash flow statements, and compute liquidity and gearing ratios for Ozoigbondu Nigeria Limited.

Ozoigbondu Nigeria Limited is a company that is into buying and selling of plastic containers. The company is financed by a capital of ₦15 million inclusive of reserves in a mix of 30% and 70% of debt and equity respectively.

The Company has been in trading business for the past six years and has consistently adhered to its corporate policy on sales, purchases, and inventory management.

The company’s policy on sales is to ensure that sales are collected as follows: (i) Cash sales is 40% of the monthly sales. (ii) The balance of the month’s sales is to be collected in the month following sales.

The policy on purchases is in agreement with the supplier’s policy which is to pay for all supplies in the month following. The company’s stock policy is to reserve 30% of the month’s purchases as closing inventory.

The following information is available for the five years 2010 to 2014:

2010 2011 2012 2013 2014
Monthly Sales 3,400,000 3,600,000 4,200,000 4,800,000 7,200,000
Monthly Purchases 2,000,000 2,400,000 2,800,000 3,200,000 4,800,000
Monthly Salaries 350,000 350,000 430,000 430,000 480,000
Monthly Rent 100,000 100,000 100,000 100,000 100,000
Monthly Cash Expenses 200,000 220,000 240,000 280,000 360,000

Additional Information: (i) The company purchased a motor vehicle in July 2013 which was paid for in September 2013. The cost of the motor vehicle was ₦5,000,000.
(ii) Annual depreciation for the motor vehicle is 20%.
(iii) The Cash Balance as at 31st December 2011 was ₦4,000,000.
(iv) The company’s salaries, rent, and expenses were paid in the month they were due.

Required: a. Prepare a Profitability Statement for 2012, 2013, and 2014. (10 Marks)
b. Prepare a Cash Flow Statement for 2012, 2013, and 2014. (7 Marks)
c. Determine and comment on the liquidity ratio (current ratio) for 2014. (2 Marks)
d. Compute the gearing ratio. (1 Mark)

Login or create a free account to see answers

Find Related Questions by Tags, levels, etc.

Report an error

You're reporting an error for "FM – May 2015 – L2 – SB – Q2 – Introduction to Performance Management"

FR – Nov 2018 – L2 – Q4 – Financial Statement Analysis

Assess the financial performance and position of Light Ltd and Favour Ltd for acquisition purposes based on profitability, liquidity, and gearing ratios.

Salt Ltd is a Government Business Entity that would like to acquire 100% of a viable private company. It has obtained the following draft financial statements for two companies, Light Ltd and Favour Ltd. They operate in the same industry, and their managements have indicated they would be receptive to a takeover.

Statement of Profit or Loss for the year ended 31 December 2017:

Description Light Ltd (GH¢’000) Favour Ltd (GH¢’000)
Revenue 12,000 20,500
Cost of sales (10,500) (18,000)
Gross profit 1,500 2,500
Operating expenses (240) (500)
Finance costs (210) (600)
Profit before tax 1,050 1,400
Income tax expense (150) (400)
Profit for the year 900 1,000
Dividends paid 250 700

Statements of Financial Position as at 31 December 2017:

Description Light Ltd (GH¢’000) Favour Ltd (GH¢’000)
Assets
Non-current assets:
Freehold factory 4,400
Owned plant 5,000 2,200
Leased plant 5,300
Total non-current assets 9,400 7,500
Current assets:
Inventory 2,000 3,600
Trade receivables 2,400 3,700
Bank 600
Total current assets 5,000 7,300
Total assets 14,400 14,800
Equity and Liabilities
Equity shares of GH¢1 each 2,000 2,000
Property revaluation reserve 900
Retained earnings 2,600 800
Total equity 5,500 2,800
Non-current liabilities
Finance lease obligations 3,200
7% loan notes 3,000
10% loan notes 3,000
Deferred tax 600 100
Government grants 1,200
Total non-current liabilities 4,800 6,300
Current liabilities
Bank overdraft 1,200
Trade payables 3,100 3,800
Government grants 400
Finance lease obligations 500
Taxation 600 200
Total current liabilities 4,100 5,700
Total equity and liabilities 14,400 14,800

Notes:

i. Both companies operate from the same premises.
ii. Additional details of the two companies’ plant are:

Description Light Ltd (GH¢’000) Favour Ltd (GH¢’000)
Owned plant – Historical cost 8,000 10,000
Leased plant – Original fair value 7,500

There were no disposals of plant during the year by either company.

iii. The interest rate implicit within Favour Ltd’s finance leases is 7.5% per annum. For the purpose of calculating ROCE and gearing, all finance lease obligations are treated as long-term interest-bearing borrowings.

Required:
Assess the relative financial performance and financial position of Light Ltd and Favour Ltd for the year ended 31 December 2017 to inform the directors of Salt Ltd in their acquisition decision. Your analysis should focus on profitability, liquidity, and gearing.
(15 marks)

Login or create a free account to see answers

Find Related Questions by Tags, levels, etc.

Report an error

You're reporting an error for "FR – Nov 2018 – L2 – Q4 – Financial Statement Analysis"

FR – Nov 2015 – L2 – Q2 – Financial Statement Analysis

This question requires calculating financial ratios and analyzing Kack Ltd's financial performance and position for the year ended 31 March 2015 compared to the previous year.

Kack Ltd is a listed company that assembles domestic electrical goods which it then sells to both wholesale and retail customers. Kack Ltd’s management was disappointed in the company’s results for the year ended 31 March 2014. In an attempt to improve performance, the following measures were taken early in the year ended 31 March 2015:

  • A national advertising campaign was undertaken.
  • Rebates to all wholesale customers purchasing goods above set quantity levels were introduced.
  • The assembly of certain lines ceased and was replaced by bought-in completed products. This allowed Kack Ltd to dispose of surplus plant.

Kack Ltd’s summarised financial statements for the year ended 31 March 2015 are set out below:

STATEMENT OF PROFIT OR LOSS AND OTHER COMPREHENSIVE INCOME
FOR THE YEAR ENDED 31 MARCH 2015

Description GHSm
Revenue (25% cash sales) 4,000
Cost of sales (3,450)
Gross profit 550
Operating expenses (370)
Operating profit 180
Profit on disposal of plant (note (i)) 40
Financial charges (20)
Profit before tax 200
Income tax expense (50)
Profit for the year 150

STATEMENT OF FINANCIAL POSITION
AS AT 31 MARCH 2015

Description GHSm GHSm
Non-current assets
Property, plant, and equipment (note (ii)) 550
Current assets
Inventory 250
Trade receivables 360
Bank nil
Total current assets 610
Total assets 1,160
Equity and liabilities
Equity
Stated capital (400m shares) 100
Income surplus 380
Total equity 480
Non-current liabilities
8% loan notes 200
Current liabilities
Bank overdraft 10
Trade payables 430
Current tax payables 40
Total current liabilities 480
Total equity and liabilities 1,160

Below are ratios calculated for the year ended 31 March 2014:

  • Return on year-end capital employed (profit before interest and tax over total assets less current liabilities): 28.1%
  • Net assets (equal to capital employed) turnover: 4 times
  • Gross profit margin: 17%
  • Net profit (before tax) margin: 6.3%
  • Current ratio: 1.6:1
  • Closing inventory holding period: 46 days
  • Trade receivables’ collection period: 45 days
  • Trade payables’ payment period: 55 days
  • Dividend yield: 3.75%
  • Dividend cover: 2 times

Notes:

  1. Kack Ltd received GHS 120 million from the sale of plant that had a carrying amount of GHS 80 million at the date of its sale.
  2. The market price of Kack Ltd’s share throughout the year averaged GHS 3.75 each.
  3. There were no issues or redemption of shares or loans during the year.
  4. Dividends paid during the year ended 31 March 2015 amounted to GHS 90 million, maintaining the same dividend paid in the year ended 31 March 2014.

Required:

a) Calculate ratios for the year ended 31 March 2015 (showing your workings) for Kack Ltd, equivalent to those provided above.
(10 marks)

b) Analyse the financial performance and position of Kack Ltd for the year ended 31 March 2015 compared to the previous year.
(10 marks)
(Total: 20 marks)

Login or create a free account to see answers

Find Related Questions by Tags, levels, etc.

Report an error

You're reporting an error for "FR – Nov 2015 – L2 – Q2 – Financial Statement Analysis"

AFM – Nov 2017 – L3 – Q1a – Role and Responsibility towards Stakeholders

Explains two reasons why interest rates rise in periods of inflation and discuss the implications of high or fluctuating interest rates on business financing and asset-holding decisions.

Under conditions of inflation, it is common for interest rates to rise possibly at a rate different from those applicable to goods and services.

Required:
i) Explain TWO possible reasons for this phenomenon.

(3 marks)

ii)

Discuss the implications of high or fluctuating interest rates for:

  • Business financing; and (3 marks)
  • Assets-holding decisions. (3 marks)

(Give examples of the types of actions that a company might take)

Login or create a free account to see answers

Find Related Questions by Tags, levels, etc.

Report an error

You're reporting an error for "AFM – Nov 2017 – L3 – Q1a – Role and Responsibility towards Stakeholders"

CR – May 2018 – L3 – Q4c – Analysis and Interpretation of Financial Statements

Analyze and compare the financial performance of two companies in terms of operating performance, liquidity, gearing, and investment ratios.

Fordland Ltd and Fiatland Ltd are two companies in the garment industry. The following are financial ratios computed by the Research Department of ICAG as part of analyzing companies’ performance industry by industry:

Ratios Fordland Ltd Fiatland Ltd
Return on Capital Employed (ROCE) 24.10% 30%
Net Assets Turnover 1.9 times 2.5 times
Gross Profit Margin 35% 20%
Net Profit Margin 10.50% 38%
Current Ratio 1.0:1 2.0:1
Quick Ratio 0.8:1 1.0:1
Inventory Holding Period 60 days 90 days
Receivables Collection Period 58 days 60 days
Payables Payment Period 50 days 50 days
Debt to Equity Ratio 50% 30%
Dividend Yield 3% 2%
Dividend Cover 2 times 1.5 times

Required:
Write a report analyzing and comparing the financial performance of Fordland Ltd and Fiatland Ltd. The report should cover operating performance, liquidity, gearing, and investment ratios. (8 marks)

Login or create a free account to see answers

Find Related Questions by Tags, levels, etc.

Report an error

You're reporting an error for "CR – May 2018 – L3 – Q4c – Analysis and Interpretation of Financial Statements"

CR – April 2022 – L3 – Q5 – Analysis and interpretation of financial statements

Write a report analyzing the financial performance and financial position of Azure Plc using financial ratios and sector averages.

Azure Plc is a company that trades its ordinary shares on the Ghana Stock Exchange. Below are the statements of profit or loss for the year ended 31 December 2020 and for the first three quarters in 2020 published in line with the Ghana Stock Exchange regulations:

Statements of profit or loss of Azure Plc:

Description Year Ended 31 Dec 2020 (Audited) Quarter 3 (Unaudited) Quarter 2 (U

naudited)

Quarter 1 (Unaudited)
Revenue GH¢ 2,829 million GH¢ 544 million GH¢ 810 million GH¢ 624 million
Cost of sales (GH¢ 1,754 million) (GH¢ 346 million) (GH¢ 489 million) (GH¢ 412 million)
Gross profit GH¢ 1,075 million GH¢ 198 million GH¢ 321 million GH¢ 212 million
Other operating income GH¢ 72 million GH¢ 32 million GH¢ 21 million GH¢ 23 million
Administrative expenses (GH¢ 572 million) (GH¢ 94 million) (GH¢ 183 million) (GH¢ 146 million)
Distribution costs (GH¢ 265 million) (GH¢ 73 million) (GH¢ 62 million) (GH¢ 65 million)
Finance costs (GH¢ 15 million) (GH¢ 11 million) (GH¢ 2 million) (GH¢ 2 million)
Profit before tax GH¢ 295 million GH¢ 52 million GH¢ 95 million GH¢ 22 million
Tax (GH¢ 101 million) (GH¢ 17 million) (GH¢ 31 million) (GH¢ 11 million)
Profit for the year GH¢ 194 million GH¢ 35 million GH¢ 64 million GH¢ 11 million

Additional information:
The following ratios have been calculated for the relevant sector for the year ended 31 December 2020:

  • Return on year-end capital employed: 18.30%
  • Return on year-end equity: 16.05%
  • Profit (before interest and tax) margin: 12.1%
  • Gross profit margin: 43.22%
  • Current ratio: 2.60
  • Quick ratio: 1.25
  • Assets turnover: 1.02
  • Debt-to-equity ratio: 30.50%

Required:
Write a report to the Board of Directors of Azure Plc, analyzing the financial performance and financial position of the company using the above information to assist the Board in determining whether strategic adjustments are required and where, if any.
(20 marks)

Login or create a free account to see answers

Find Related Questions by Tags, levels, etc.

Report an error

You're reporting an error for "CR – April 2022 – L3 – Q5 – Analysis and interpretation of financial statements"

CR – Nov 2018 – L3 – Q5b – Regulatory Framework and Ethics

Appraise the ethical issues arising from the email received by Peter Anokye regarding liquidity challenges and lease accounting implications in Nanton Ltd

You are Peter Anokye, a newly qualified accountant and have recently been appointed as the deputy financial controller in Nanton Ltd (Nanton). You report directly to the finance director, Maria Wakasu. Just last week, you received the following email from Maria.

“As you are aware, I have to present some financial information at the board meeting scheduled in two days’ time and I need your help. I should be grateful if you could give me some advice on this issue. I don’t know whether you heard the news that Mamprugo Ltd (Mamprugo), an important customer of ours, is having some liquidity challenges. I think it is a case of not being able to manage their working capital cycle effectively. I know the financial controller of Mamprugo well, and he has mentioned that they have approached Yendi Ltd (Yendi) for credit. Of course, if they are successful, we should have no problems in getting paid. Today, I have received a request from Yendi asking for a credit reference for Mamprugo. I think if you check their credit history you will find they were good payers. Do you think I should mention anything about the liquidity issue to Yendi?

As I mentioned to you yesterday, over coffee, the Chief Executive Officer (CEO) regards leasing as an important method of financing the company. However, you are probably more up to date with the existing accounting requirements than me. The current accounting standard has some significant deficiencies and no longer meets the needs of users of financial statements. On 1 January 2016, we entered into a sale and finance leaseback transaction with our bank. The arrangement involved the sale, at fair value, of a building for GH¢8 million. The book value of the building in the financial statements at that date was GH¢6 million. I know that the CEO is particularly concerned that showing the lease as a finance lease could be detrimental to any loan applications that we might make over the next twelve months. Between you and I, we need to keep him happy: my year-end bonus could be in jeopardy if we get this area wrong. In the medium term, I am worried about the implications of the introduction of IFRS 16: Leases, particularly the effects on the statement of financial position, statement of profit and loss and other comprehensive income, and our key financial ratios. Surely our gearing ratio will be higher. Maybe we can get round the problem of including leases on the statement of financial position by classifying some of them as short-term (i.e., less than twelve months).

Peter, I should be grateful if you could give me some advice on this issue.”

Required:
Appraise the ethical issues arising from the information provided in the mail sent by Maria, and propose and justify appropriate steps that Peter Anokye should take to address them.

Login or create a free account to see answers

Find Related Questions by Tags, levels, etc.

Report an error

You're reporting an error for "CR – Nov 2018 – L3 – Q5b – Regulatory Framework and Ethics"

CR – Aug 2022 – L3 – Q5 – Analysis and interpretation of financial statements

This question requires writing a report that assesses the comparative performance of a company using various financial ratios (profitability, liquidity, efficiency, and gearing).

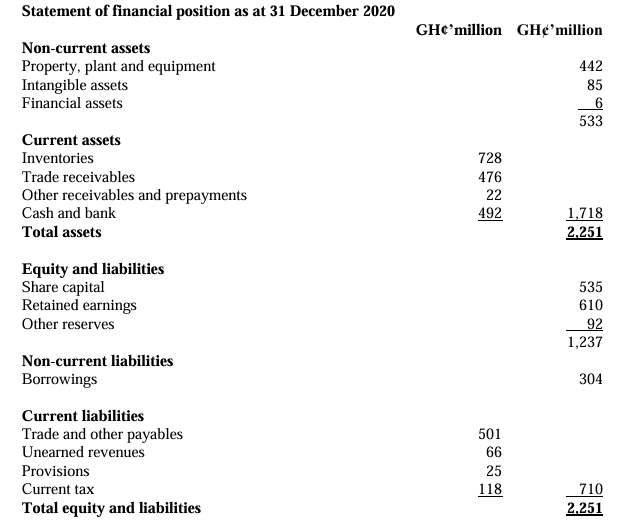
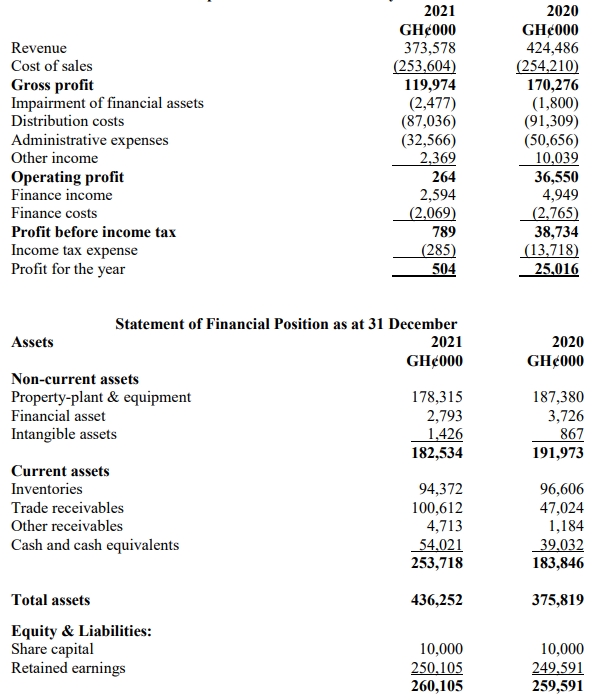
Wadie Ltd has been in operation for the past ten years. The company started operations in Kumasi with just three employees, but currently operates in all regions of Ghana, with over five hundred employees.

The final meeting for the year of the Board of Directors of the company is to be convened, and as a tradition, the Finance Manager presented an analysis of the financial performance of the company for the financial year ended 31 December 2021. Below are the financial statements for the year ended 31 December 2021:

Statement of Comprehensive Income for the year 31 December

Additional Information:

i) Finance income relates to interest earned on the company’s investment in Government of Ghana loan notes.

ii) Dividend payable represents the dividend declared or approved by shareholders at the last Annual General Meeting.

Required:

As the Finance Manager of the company, write a report to the Board of Directors, assessing the comparative performance of the company for the year ended 31 December 2021. Your report should use THREE (3) profitability ratios, TWO (2) liquidity ratios, THREE (3) efficiency ratios, and TWO (2) gearing ratios.


Login or create a free account to see answers

Find Related Questions by Tags, levels, etc.

Report an error

You're reporting an error for "CR – Aug 2022 – L3 – Q5 – Analysis and interpretation of financial statements"

CR – Nov 2016 – L3 – Q4b – Analysis and interpretation of financial statements

Write a report comparing Decimal Ltd’s financial performance with industry averages in terms of profitability, liquidity, efficiency, and shareholders’ investment.

Below are the financial ratios for the year 2015 for Decimal Ltd, a company engaged in the buying and shipment of agricultural products. The ratios for the industry have also been provided.

Ratios Decimal Ltd Industry Average
Quick ratio 0.52:1 0.84:1
Current ratio 1.20:1 1.80:1
Debtors collection period 46 days 41 days
Creditors payment period 70 days 50 days
Inventory holding period 58 days 48 days
Dividend yield 3.6% 9.0%
Debt to equity 85% 45%
Dividend cover 1.4 times 3.4 times
Gross profit margin 18% 28%
Net profit margin 8% 12.8%
Return on capital employed 28% 14%
Net assets turnover 4.2 times 1.9 times

Required:
Write a report to the Shareholders of Decimal Ltd assessing its performance in comparison with the industry in respect of profitability, liquidity, efficiency, and shareholders’ investment.
(10 marks)

Login or create a free account to see answers

Find Related Questions by Tags, levels, etc.

Report an error

You're reporting an error for "CR – Nov 2016 – L3 – Q4b – Analysis and interpretation of financial statements"

CR – Dec 2022 – L3 – Q5 – Analysis and Interpretation of Financial Statements

Evaluate Partey Ltd's performance using key financial ratios for profitability, liquidity, efficiency, and gearing.

Partey Ltd is a company engaged in continuous casting and cold rolling of aluminum products in Ghana. The company has been in operation for several decades, and its operations did not change in the year ended 31 December 2021.

Below are financial statements for the years 2021 and 2020:

Statement of Profit or Loss and Other Comprehensive Income

2021 (GH¢000) 2020 (GH¢000)
Revenue 389,507 445,963
Cost of sales (240,731) (237,345)
Gross profit 148,776 208,618
Other income 19,315 10,983
Distribution costs (76,366) (108,137)
Administrative expenses (74,520) (46,216)
Operating profit 17,205 65,248
Finance cost (21,287) (21,537)
Profit before tax (4,082) 43,711
Tax expense (16,521)
Profit for the year (4,082) 27,190

Statement of Financial Position

2021 (GH¢000) 2020 (GH¢000)
Non-current assets:
Property, plant and equipment 196,784 183,190
Investment securities 137 348
Total non-current assets 196,921 183,538
Current assets:
Inventories 50,400 66,351
Trade receivables 23,769 27,688
Other receivables 9,343 1,833
Cash and cash equivalents 45,969 20,699
Total current assets 129,481 116,571
Total assets 326,402 300,109
Equity and Liabilities:
Stated capital 10,000 10,000
Retained earnings 124,575 111,676
Total equity 134,575 121,676
Non-current liabilities:
15% Loan notes 8,580 10,247
20% Loan notes (NGIC Pension Fund) 100,000 100,000
Total non-current liabilities 108,580 110,247
Current liabilities:
Trade payables 80,182 65,082
Current tax 3,104
Accrued expenses 3,065
Total current liabilities 83,247 68,186
Total equity and liabilities 326,402 300,109

Required:

a) As the Finance Manager of Partey Ltd, you have been tasked by the Board of Directors to produce a report. Assess the performance of the company over time based on profitability, liquidity, efficiency, and gearing.
(Note: Your report should include TWO (2) ratios each of profitability, liquidity, efficiency, and gearing).
(16 marks)

b) Management of the company wants to achieve improvement in technology and production processes to stimulate growth. However, this will require further injection of funds and less strain on operating cash flows. To achieve this, the Board of Directors of the company has resolved to convince the company’s largest debtholder, NGIC Pension Fund, to exercise the conversion right attached to the debt. The total value of the debt included in the financial statements for both financial years is GH¢100 million. The debt was issued at a coupon rate of 20% per annum. The annual coupon payments are also included in the financial statements above for both financial years. NGIC Pension Fund is also the second-largest shareholder of the company.

The estimated tax expense on the company’s profit for the year ended 31 December 2021, if the debt owed to NGIC Pension Fund is converted, is GH¢3.172 million. Current tax liability at 31 December 2021 is expected to increase by the same amount.

Required:
Assess the performance of the company for the year ended 31 December 2021 upon conversion of the debt owed to NGIC Pension Fund on 1 January 2021 at its carrying amount.
(4 marks)

Login or create a free account to see answers

Find Related Questions by Tags, levels, etc.

Report an error

You're reporting an error for "CR – Dec 2022 – L3 – Q5 – Analysis and Interpretation of Financial Statements"

CSEG – Nov 2018 – L2 – Q1- Analysing the internal environment

Analyzing the internal environment, Strategic management process, Financial planning and forecasting, Liquidity management, Long-term capital raising

GHANA’S FOOTWEAR MANUFACTURING INDUSTRY

Introduction:

The footwear industry has many players including artisanal shoemakers, local and foreign manufacturers, with local representatives, producing a wide range of footwear. In Ghana, the footwear industry is making headway in the local market, with most of the shoes being produced in Kumasi. The Kumasi Shoe Manufacturing Company focuses on making footwear for almost all the security agencies in Ghana, as well as some private security companies. The local market is also filled with individual artisans and small startup companies who make footwear for sale in the country. The other regions in the country such as the Greater Accra Region and the Northern Region also have a few individuals who are into footwear manufacturing but on a smaller scale.

Foreign-produced footwears are of superior quality and attract skimming pricing compared to the locally produced ones. The sector is projected to have high growth potential with most of its forecasted sales to emanate from low-income segments with marginal and flat growth from middle and high-income segments respectively. The growth, among other things, will be fueled by the government’s free school uniform and sandals policy which is expected to be sourced from local manufacturers. In Ghana, luxury shoes are usually European or American brands. The luxury footwear production in Ghana is still a virgin market with a lot of potential once people start to believe in the high quality these Ghanaian brands can offer.

On average, it takes three to five years for local manufacturers to ramp up production significantly enough to drive down average fixed cost and attain utilization of full capacity due to intense competition and difficulty accessing the major wholesale and retail outlets trading in footwears. The foreign as well as a good number of local manufacturers sign 5 to 10 years contract with major outlets in all the major urban centres for exclusive rights to sell their footwears.

The artisanal shoemakers generally produce based on customer orders. In the Footwear industry, customers easily source from many available alternatives. The key customers of foreign and local manufacturers are the various wholesale and retail outlets. There are emerging online shops providing information on prices of goods and services from different manufacturers including footwears free of charge and consumers can easily access that information. The profit margins for the outlets are generally low. There have been recent acquisitions of some local footwear manufacturing companies by some major wholesale and retail distributors in Ghana and the experts are predicting more of such transactions.

In Ghana, there is a cartel of few major importers, controlling approximately 90% of high-quality natural and synthetic leather markets, from whom many local manufacturers and artisanal shoemakers procure their raw materials. These importers source their supplies largely from Europe, which compares favourably, in terms of quality and price, to those available in neighbouring countries. A recent consumer survey indicates that footwear produced with inputs from Europe are durable, of good quality and able to stand high-temperature conditions locally hence consumer preference.

Footwear Ventures Ltd (FVL)

Footwear Ventures Ltd (FVL) was founded by Peter Legubo, who graduated with a bachelor’s degree in Fine Arts, from a public university in Ghana. Prior to starting the company, Peter met one of his schoolmates, who owned a business that specialized in traditional handicrafts including footwear. He was able to convince him to join FVL. The schoolmate’s hands-on experience coupled with Peter’s competence in drawing and designing will be complementary and indispensable to gaining competitive edge. The initial capital for the company was raised from personal savings and severance package received by Peter from his former employment. He was able to acquire requisite tools and machines for the production of footwear.

Based on the determination and ambition of the founder, FVL outdoored its first production line with four different products including shoes and sandals for men, women, children as well as boots for security personnel. The products were well received by the public. The company continued production but it could hardly produce the quantity required by its retailers due to inadequate funding. Peter, therefore, approached some banks for credit facility but due to lack of credit history he was unsuccessful. Peter Legubo decided to turn to his friend, Kingsford Yeboah, who lived in Germany and had earlier expressed interest in investing in the business. Kingsford provided the business with a substantial amount of cash. The capital injection was used to buy more tools and machines in a bid to significantly automate the production process. Additional hands were engaged bringing the total number of employees to 100. Currently, the company produces on average 2,200 pairs of shoes per month.

The main raw materials for footwear, including natural and synthetic leather, synthetic sole and adhesive, are sourced from local importers. FVL is contemplating diversifying its raw materials. The shoes produced by the company are largely distributed through major retail shops dotted across major urban centres since FVL does not have the required resources to open its own sales outlets. The company also does direct sales to students on campuses of some tertiary institutions in the country.

On strategic approach, Peter believes the company should continue to exclusively rely on the engagement of experienced hands from the industry and should waste no time in formalizing and documenting the company’s strategy. Kingsford Yeboah also believes that the company should institutionalize a strategic approach that should focus on the strategy process, financial planning and forecasting as well as sources of finances.

Financial planning and forecasting

FVL has the potential of becoming a leading producer of footwear in the Ghanaian market. It is however faced with liquidity challenges. The management of FVL has decided to prepare a six-month budget in order to better manage its liquidity needs and avoid any shortages, especially in the light of limited access to bank credit.

Financial data

FVL has planned production and sales for the next nine months as follows:

Month April May June July August September October November December
Production (Units) 700 800 1,000 1,200 1,200 1,400 1,500 1,500 1,500
Sales (Units) 700 800 800 1,000 1,200 1,300 1,400 1,600 1,500

During the period, the business plans to advertise so as to achieve the projected sales. Payments for advertising of GH¢12,000 and GH¢18,000 will be made in June and September respectively. The selling price per unit will be GH¢120 throughout the period. 40% of sales are normally made on two months’ credit. The other 60% are settled within the month of the sale.

Raw materials used for the footwear will be held for one month before they are taken into production. Purchases of raw materials will be on one month’s credit. The cost of raw materials is GH¢60 per unit of production. Other direct production expenses, including labour, are GH¢25 per unit. These will be paid in the month incurred. Various production overheads, which during the period to 30 May had run at GH¢21,600 a month, are expected to rise to GH¢24,000 each month from 1 June to 30 September. These are expected to rise again from 1 October to GH¢28,800 a month and to remain at that level for the foreseeable future. These overheads include a steady GH¢4,800 each month for depreciation. Overheads are planned to be paid 80% in the month of production and 20% in the following month.

To help meet the planned increased production, a new item of plant will be bought and delivered in July. The cost of this item is GH¢79,200; the contract with the supplier will specify that this will be paid in three equal installments in August, September, and October. Raw materials inventories are planned to be 1,000 units on 1 June. The balance at the bank on the same day is planned to be GH¢89,000. The company earns 5% interest on the closing balance, which is paid in the following month.

Required:

a) Analyze the strengths and weaknesses of FVL. (6 marks)

b) Prepare a report to the Director of FVL on the process of strategic management. (8 marks)

c) Prepare a cash budget for the six months ending 30 November based on the financial data of FVL. Show all workings. (12 marks)

d) Recommend to the Directors of FVL FOUR (4) strategies for overcoming the liquidity crisis. (8 marks)

e) Advise the directors of FVL FOUR (4) methods of raising long-term capital. (6 marks)

Login or create a free account to see answers

Find Related Questions by Tags, levels, etc.

Report an error

You're reporting an error for "CSEG – Nov 2018 – L2 – Q1- Analysing the internal environment"

Oops!

This feature is only available in selected plans.

Click on the login button below to login if you’re already subscribed to a plan or click on the upgrade button below to upgrade your current plan.

If you’re not subscribed to a plan, click on the button below to choose a plan