Question Tag: Financial Performance

Search 500 + past questions and counting.
  • Filter by Professional Bodies

  • Filter by Subject

  • Filter by Series

  • Filter by Topics

  • Filter by Levels

PSAF – Nov 2024 – L2 – Q4a – Financial Ratio Analysis

Compute financial ratios for Ghana Wind Farms LTD to analyze performance trends.

Ghana Wind Farms LTD, a State-Owned Enterprise (SOE), has appointed a new Board of Directors in January 2023. The new Board, after settling for a year, is interested in assessing their performance for the year 2023 against the performance of the previous Board in the year 2022 through ratio analysis. Below is the financial statement of Ghana Wind Farms LTD for the two years.


Ghana Wind Farms LTD

Statement of Profit or Loss for the Year Ended 31 December 2023

2023 (GH¢) 2022 (GH¢)
Revenue 9,860,000 6,218,000
Direct Cost (5,905,000) (5,822,000)
Gross Profit 3,955,000 396,000
Distribution Costs (297,000) (264,000)
Administrative Expenses (505,000) (455,000)
Other Income 236,000 13,000
Other Gains 1,482,000
Operating Profit 3,389,000 1,172,000
Finance Cost (1,000,000) (334,000)
Profit Before Tax Expense 2,389,000 838,000
Tax Expense (500,000) (144,000)
Profit After Tax 1,889,000 694,000

Ghana Wind Farms LTD

Statement of Financial Position as at 31 December 2023

2023 (GH¢) 2022 (GH¢)
ASSETS
Non-Current Assets
Property, Plant & Equipment 17,000,000 15,000,000
Investment 5,000 2,000
Advances & Loans 30,000
Total Non-Current Assets 17,005,000 15,032,000
Current Assets
Inventories 687,000 546,000
Trade and Other Receivables 2,829,000 1,978,000
Prepayments 87,000 42,000
Cash and Cash Equivalents 383,000 434,000
Total Current Assets 3,986,000 3,000,000
TOTAL ASSETS 20,991,000 18,032,000
EQUITY & LIABILITIES
Equity
Government Equity 8,000 8,000
Other Government Equity 613,000 306,000
Capital Surplus 8,471,000 7,599,000
Income Surplus (1,434,000) 478,000
Total Equity 7,970,000 8,697,000
Non-Current Liabilities
Deferred Credit 6,692,000 670,000
Deferred Tax Liabilities 2,498,000 2,572,000
Borrowings (Due After One Year) 1,297,000 950,000
Total Non-Current Liabilities 10,487,000 4,192,000
Current Liabilities
Bank Overdraft 166,000 180,000
Provision for Company Tax 109,000 109,000
Trade and Other Payables 1,820,000 4,516,000
Borrowings (Due Within One Year) 439,000 338,000
Total Current Liabilities 2,534,000 5,143,000
Total Liabilities 13,021,000 9,335,000
TOTAL EQUITY AND LIABILITIES 20,991,000 18,032,000

Required:

a) Compute the following ratios:

i) Current Ratio
ii) Quick Ratio
iii) Inventory Turnover (Days)
iv) Trade Receivable Collection Period (Days)
v) Trade Payables Period (Days)
vi) Working Capital Cycle
vii) Interest Cover Ratio
viii) Total Debt – Total Asset Ratio

Login or create a free account to see answers

Find Related Questions by Tags, levels, etc.

Report an error

You're reporting an error for "PSAF – Nov 2024 – L2 – Q4a – Financial Ratio Analysis"

MA – Nov 2024 – L2- Q1b – Return on Investment (ROI)

Computation of ROI for different one-off transactions and advice on whether they should be undertaken.

Dondo LTD is a manufacturing company based in Nsawam. The following data represents the budgeted performance of Dondo LTD for the year 2025:

Amount (GH¢’000)
Profit 660
Plant and equipment (net of depreciation) 1,560
Working capital 750

Dondo LTD is considering undertaking the following separate one-off transactions:

  1. A cash discount of GH¢16,000 will be offered to its customers annually. This will, on average, reduce the trade receivables figure by GH¢60,000.
  2. An increase in average inventories by GH¢80,000 throughout the year. The increased inventory level is expected to increase sales, resulting in GH¢30,000 increased contribution per annum.
  3. At the beginning of the year, the company will buy a plant worth GH¢360,000. This is expected to reduce operating costs by GH¢105,000. The plant has a five-year useful life with nil residual value.

Required:

i) Compute the ROI for each of the one-off transactions above. 
ii) Advise Dondo LTD on whether the above one-off transactions should be carried out.

Login or create a free account to see answers

Find Related Questions by Tags, levels, etc.

Report an error

You're reporting an error for "MA – Nov 2024 – L2- Q1b – Return on Investment (ROI)"

FM – Nov 2016 – L3 -SB – Q3 – Capital Gains Tax

Calculate EVA for Jack Limited and determine its market value added (MVA) based on provided assumptions.

Jack Limited is a family-owned business that has grown strongly in the last 50 years. The key objective of the company is to maximise the family’s wealth through their shareholdings. Recently, the directors introduced value-based management, using Economic Value Added (EVA) as the index for measuring performance.

You are provided with the following financial information:

Statement of Profit or Loss and Other Comprehensive Income for the year ended December 31, 2015:

₦’million 2015
Operating profit 340.0
Finance charges (115.0)
Profit before tax 225.0
Tax at 25% (56.3)
Profit after tax 168.7

Notes

Notes 2015 (₦’m) 2014 (₦’m)
(i) Capital employed – from the Statement of Financial Position 6,285 6,185
(ii) Operating costs:
Depreciation 295 285
Provision for doubtful debts 10 2.5
Research and development 60
Other non-cash expenses 35 30
Marketing expenses 50 45
(iii) Economic depreciation is assessed to be ₦415 in 2015. Economic depreciation includes any appropriate amortisation adjustments. In previous years, it can be assumed that economic and accounting depreciation were the same.
(iv) Tax is the cash paid in the current year (₦45million) and an adjustment of ₦2.5million for deferred tax provisions. There was no deferred tax balance prior to 2015.
(v) The provision for doubtful debts was ₦22.5million on the 2015 Statement of Financial Position.
(vi) Research and development cost is not capitalised in the accounts. It relates to a new project that will be developed over five years and is expected to be of long-term benefit to the company. The first year of this project is 2015.
(vii) The company has been spending heavily on marketing each year to build its brand long term.
(viii) Estimated cost of capital of the company:
Equity 16%
Debt (pre-tax) 5%
(ix) Gearing (Debt/Equity) Ratio 1.5: 1

Required:
a. Calculate, showing all relevant workings, the Economic Value Added (EVA) for the year ended December 31, 2015. Make use of the adjusted opening capital employed. Comment on your result and make appropriate recommendations. (15 Marks)

b. Irrespective of your answer in (a) above, assume the company’s current EVA is ₦120million and that this will decline annually by 2% for the next ten years and then increase by 4% per annum in perpetuity. Assume the following for this part only:

  • Cost of equity 14%
  • WACC 10%

Calculate the market value added (MVA) by the company. Show all workings. (5 Marks)

Login or create a free account to see answers

Find Related Questions by Tags, levels, etc.

Report an error

You're reporting an error for "FM – Nov 2016 – L3 -SB – Q3 – Capital Gains Tax"

CR – May 2017 – L3 – Q7b – Integrated Reporting

Discuss the usefulness of cash flow statements and the potential benefits of integrated reporting.

The directors of Duranga Plc. have learned that corporate reporting could be improved by adopting the International Integrated Reporting Council’s Framework for Integrated Reporting. The directors believe that International Financial Reporting Standards (IFRS), which the company has recently adopted following the decision of the Federal Executive Council, are already extensive and provide stakeholders with a comprehensive understanding of its financial position and performance for the year. They believe that with over 100 countries adopting IFRS, their financial statements speak the international financial reporting language and practice. In particular, statements of cash flows, which the company prepares in accordance with IAS 7, enable stakeholders to assess the liquidity, solvency, and financial adaptability of a business. They are concerned that any additional disclosures could be excessive and obscure the most useful information within a set of financial statements. This is against the backdrop of a recent effort by the IASB on excessive disclosures in financial statements. They are therefore unsure of the rationale for the implementation of a separate or combined integrated report.

Required:
Discuss the extent to which statements of cash flow provide stakeholders with useful information about an entity and whether this information would be improved by the entity introducing an Integrated Report. (6 Marks)

Login or create a free account to see answers

Find Related Questions by Tags, levels, etc.

Report an error

You're reporting an error for "CR – May 2017 – L3 – Q7b – Integrated Reporting"

CR – May 2017 – L3 – Q5 – Integrated Reporting

Identify voluntary disclosures in annual reports and discuss reasons for and limitations of such disclosures.

An annual report is a comprehensive report on a company’s activities intended to give information about the company’s activities and financial performance. In addition to the audited financial statements, annual reports contain a great deal of extra information which could be financial and non-financial. The extra information provided may be required by law, hence, it is mandatory. However, many companies provide additional information not required by law, on a voluntary basis.

Required:

(a) Identify THREE of such reports that are voluntarily disclosed in annual reports of Nigerian companies. (3 Marks)

(b) Why would a company disclose information not required by law in its annual report? Propose FOUR reasons for and give any TWO limitations of such disclosures. (7 Marks)

Login or create a free account to see answers

Find Related Questions by Tags, levels, etc.

Report an error

You're reporting an error for "CR – May 2017 – L3 – Q5 – Integrated Reporting"

CR – Nov 2016 – L1 – SB – Q2 – Earnings Per Share (IAS 33)

Evaluate the significance, shortcomings, and calculations of EPS for Soar Plc.

The objective of IAS 33 – Earnings Per Share is to improve the comparability of the performance of different entities in the same period and of the same entity in different accounting periods. This is done by prescribing the methods for determining the numbers of shares to be included in the calculation of earnings per share. The management of Soar Plc had sought your professional advice on the application of IAS 33.

a. You are required to advise the management of Soar Plc on the:
i. Significance of earnings per share. (5 marks)
ii. Shortcomings of earnings per share. (5 marks)

b. The directors of Soar Plc have decided to replace most of the existing plant and machinery which are now obsolete during the year ended September 30, 2015, to enhance earnings. The costs of removing existing plant and acquiring and installing new plant have been estimated at N750,000.

In order to improve liquidity, the directors decided to make a new issue of 800,000 ordinary shares at N2 per share fully paid on January 1, 2015, and a further N600,000 4% convertible loan notes on June 1, 2015. The terms of issue would provide for conversion into ordinary shares as stated below:

On September 30 Number of shares per N100 of loan stock
2015 120
2016 125
2017 118
2018 122

The ordinary shares issued would rank for dividend in the current year. The following relates to the company for the period ended September 30, 2015:

  • Profit before interest and tax is N850,000.
  • Effective rate of company tax on profit is 30% and the basic EPS for the year ended September 30, 2014, was 48 kobo.
  • The company had issued as at September 30, 2014, the following:
    • 2,000,000 ordinary shares of 50 kobo each fully paid.
    • 400,000 12% irredeemable preference shares of N1 each fully paid.
    • 300,000 10% redeemable preference shares of N1 each fully paid.
    • N700,000 8% redeemable debenture (non-convertible).

Required:
Calculate for Soar Plc for the year ended September 30, 2015:
i. Basic earnings per share (5 marks).
ii. Fully diluted earnings per share (5 marks).

Login or create a free account to see answers

Find Related Questions by Tags, levels, etc.

Report an error

You're reporting an error for "CR – Nov 2016 – L1 – SB – Q2 – Earnings Per Share (IAS 33)"

CR – Nov 2014 – L3 – SB – Q3 – Presentation of Financial Statements (IAS 1)

Analyze Prochain Plc’s financial performance and calculate key ratios for loan covenants.

Prochain Plc

The Directors of Prochain Plc have pursued an aggressive policy of expansion in the last two years. They have developed several new products and market share has increased.

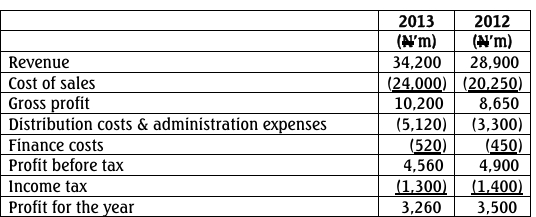
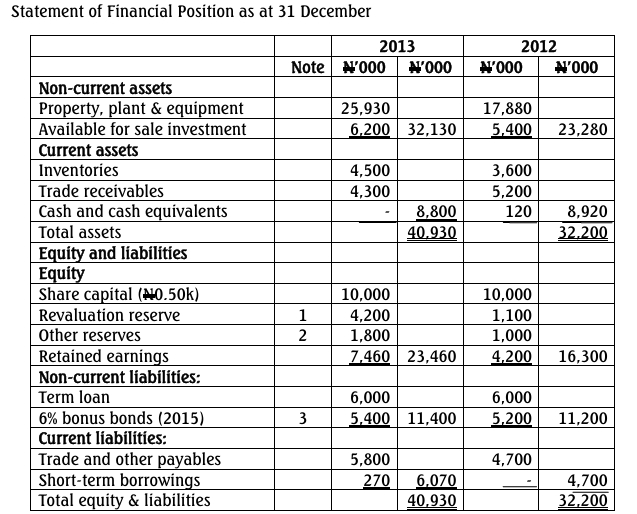
The financial statements for the year ended 31 December 2013, which will be presented to the Board of Directors at its next meeting, are being finalised. The financial statements at the year-end are presented below:

Statement of profit or loss and other comprehensive income for the year ended 31 December

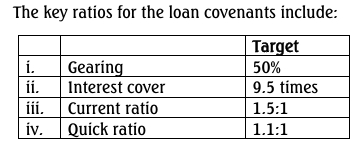
The results of the company as well as certain key ratios that will form part of the covenants in respect of the loan facilities will be discussed at the Board of Directors meeting.

Notes:

  1. The movement on the revaluation reserve relates to property, plant, and equipment revalued in the year.
  2. The movement on other reserves relates to the gains on the investments available for sale.
  3. The bonds are repayable on 1 July 2015.

Required:

(a) Based on the results of Prochain Plc for the year ended 31 December 2013, calculate the key ratios for the loan.
(8 Marks)

(b) Prepare a report commenting on the financial performance for the year in relation to the key ratios for the loan.
(12 Marks)

(Total 20 Marks)

Login or create a free account to see answers

Find Related Questions by Tags, levels, etc.

Report an error

You're reporting an error for "CR – Nov 2014 – L3 – SB – Q3 – Presentation of Financial Statements (IAS 1)"

FM – Nov 2016 – L3 – Q3 – Strategic Performance Measurement

Calculation of EVA for Jack Limited using adjusted financial data and WACC to assess value creation.

Jack Limited is a family-owned business which has grown strongly in the last 50 years. The key objective of the company is to maximize the family’s wealth through their shareholdings. Recently, the directors introduced value-based management, using Economic Value Added (EVA) as the index for measuring performance.

You are provided with the following financial information:

Statement of Profit or Loss and Other Comprehensive Income for the Year Ended December 31, 2015

Item Amount (₦’million)
Operating profit 340.0
Finance charges (115.0)
Profit before tax 225.0
Tax at 25% (56.3)
Profit after tax 168.7

Notes

Description 2015 (₦’m) 2014 (₦’m)
(i) Capital employed – from the Statement of Financial Position 6,285 6,185
(ii) Operating costs: Depreciation 295 285
Provision for doubtful debts 10 2.5
Research and development 60
Other non-cash expenses 35 30
Marketing expenses 50 45
  1. Economic depreciation is assessed to be ₦415 in 2015. Economic depreciation includes any appropriate amortization adjustments. In previous years, it can be assumed that economic and accounting depreciation were the same.
  2. Tax: The cash paid in the current year is ₦45 million, with an adjustment of ₦2.5 million for deferred tax provisions. There was no deferred tax balance prior to 2015.
  3. The provision for doubtful debts was ₦22.5 million on the 2015 Statement of Financial Position.
  4. Research and development cost is not capitalized in the accounts. It relates to a new project that will be developed over five years and is expected to be of long-term benefit to the company. The first year of this project is 2015.
  5. The company has been spending heavily on marketing each year to build its brand long-term.
  6. Estimated cost of capital for the company:
    • Equity: 16%
    • Debt (pre-tax): 5%
  7. Gearing (Debt/Equity) Ratio: 1.5:1

Login or create a free account to see answers

Find Related Questions by Tags, levels, etc.

Report an error

You're reporting an error for "FM – Nov 2016 – L3 – Q3 – Strategic Performance Measurement"

CR – Nov 2016 – L3 – Q2a – Earnings Per Share (IAS 33)

Explanation of the significance and shortcomings of Earnings Per Share (EPS) for Soar Plc’s management.

The objective of IAS 33 – Earnings Per Share is to improve the comparability of the performance of different entities in the same period and of the same entity in different accounting periods. This is done by prescribing the methods for determining the numbers of shares to be included in the calculation of earnings per share. The management of Soar Plc has sought your professional advice on the application of IAS 33.

Required: Advise the management of Soar Plc on the following:

i. Significance of Earnings Per Share (EPS). (5 marks)
ii. Shortcomings of Earnings Per Share (EPS). (5 marks)

Login or create a free account to see answers

Find Related Questions by Tags, levels, etc.

Report an error

You're reporting an error for "CR – Nov 2016 – L3 – Q2a – Earnings Per Share (IAS 33)"

FR – May 2017 – L2 – SB – Q4 – Earnings Per Share (IAS 33)

Explain EPS and PE ratio, and calculate EPS and DPS for Almond Nigeria Limited, also discussing EPS limitations.

a. Explain the following, stating their importance to investors in evaluating financial performance:
i. Earnings per share (EPS)
ii. Price earnings ratio (PE ratio)
(6 Marks)

b. The issued and fully paid share capital of Almond Nigeria Limited, which has remained unchanged since the date of incorporation until the financial year ended March 31, 2015, includes the following:

  • 2,400,000,000 ordinary shares
  • 600,000,000 6% participating preference shares of N1 each

The company has been operating at a profit for a number of years. As a result of a very conservative dividend policy in previous years, there is a large accumulated profit balance on the statement of financial position.

On July 1, 2015, the directors decided to issue two bonus shares to all ordinary shareholders for every one previously held.

The following is an extract of the group statement of profit or loss and other comprehensive income for the year ended March 31, 2016:

Almond Nigeria Limited
Extract of Group Statement of Profit or Loss and Other Comprehensive Income for the Year Ended March 31, 2016

2016 2015
Profit for the year N740,000 N540,000
Other comprehensive income (20,000)
Total comprehensive income N740,000 N520,000
Total comprehensive income attributable to:
Owners of parent N680,000 N480,000
Non-controlling interest N60,000 N40,000
Total comprehensive income N740,000 N520,000

The following dividends have been paid or declared at the end of the period:

Dividend Type 2016 2015
Ordinary N330,000 N240,000
Preference N69,000 N60,000

Note: The participating preference shareholders are entitled to share profits in the same ratio in which they share dividends after payment of fixed preference dividends. They will also share the same benefit as ordinary shareholders if the company is liquidated.

Required:

  1. Calculate the earnings per share (EPS) in accordance with IAS 33 and the dividend per share (DPS) for the years ended March 31, 2015, and 2016. (10 Marks)
  2. Discuss the limitations of earnings per share (EPS) as a measure of a company’s performance. (4 Marks)

Login or create a free account to see answers

Find Related Questions by Tags, levels, etc.

Report an error

You're reporting an error for "FR – May 2017 – L2 – SB – Q4 – Earnings Per Share (IAS 33)"

FR – Nov 2018 – L2 – Q4 – Financial Statement Analysis

Assess the financial performance and position of Light Ltd and Favour Ltd for acquisition purposes based on profitability, liquidity, and gearing ratios.

Salt Ltd is a Government Business Entity that would like to acquire 100% of a viable private company. It has obtained the following draft financial statements for two companies, Light Ltd and Favour Ltd. They operate in the same industry, and their managements have indicated they would be receptive to a takeover.

Statement of Profit or Loss for the year ended 31 December 2017:

Description Light Ltd (GH¢’000) Favour Ltd (GH¢’000)
Revenue 12,000 20,500
Cost of sales (10,500) (18,000)
Gross profit 1,500 2,500
Operating expenses (240) (500)
Finance costs (210) (600)
Profit before tax 1,050 1,400
Income tax expense (150) (400)
Profit for the year 900 1,000
Dividends paid 250 700

Statements of Financial Position as at 31 December 2017:

Description Light Ltd (GH¢’000) Favour Ltd (GH¢’000)
Assets
Non-current assets:
Freehold factory 4,400
Owned plant 5,000 2,200
Leased plant 5,300
Total non-current assets 9,400 7,500
Current assets:
Inventory 2,000 3,600
Trade receivables 2,400 3,700
Bank 600
Total current assets 5,000 7,300
Total assets 14,400 14,800
Equity and Liabilities
Equity shares of GH¢1 each 2,000 2,000
Property revaluation reserve 900
Retained earnings 2,600 800
Total equity 5,500 2,800
Non-current liabilities
Finance lease obligations 3,200
7% loan notes 3,000
10% loan notes 3,000
Deferred tax 600 100
Government grants 1,200
Total non-current liabilities 4,800 6,300
Current liabilities
Bank overdraft 1,200
Trade payables 3,100 3,800
Government grants 400
Finance lease obligations 500
Taxation 600 200
Total current liabilities 4,100 5,700
Total equity and liabilities 14,400 14,800

Notes:

i. Both companies operate from the same premises.
ii. Additional details of the two companies’ plant are:

Description Light Ltd (GH¢’000) Favour Ltd (GH¢’000)
Owned plant – Historical cost 8,000 10,000
Leased plant – Original fair value 7,500

There were no disposals of plant during the year by either company.

iii. The interest rate implicit within Favour Ltd’s finance leases is 7.5% per annum. For the purpose of calculating ROCE and gearing, all finance lease obligations are treated as long-term interest-bearing borrowings.

Required:
Assess the relative financial performance and financial position of Light Ltd and Favour Ltd for the year ended 31 December 2017 to inform the directors of Salt Ltd in their acquisition decision. Your analysis should focus on profitability, liquidity, and gearing.
(15 marks)

Login or create a free account to see answers

Find Related Questions by Tags, levels, etc.

Report an error

You're reporting an error for "FR – Nov 2018 – L2 – Q4 – Financial Statement Analysis"

CR – May 2018 – L3 – Q4c – Analysis and Interpretation of Financial Statements

Analyze and compare the financial performance of two companies in terms of operating performance, liquidity, gearing, and investment ratios.

Fordland Ltd and Fiatland Ltd are two companies in the garment industry. The following are financial ratios computed by the Research Department of ICAG as part of analyzing companies’ performance industry by industry:

Ratios Fordland Ltd Fiatland Ltd
Return on Capital Employed (ROCE) 24.10% 30%
Net Assets Turnover 1.9 times 2.5 times
Gross Profit Margin 35% 20%
Net Profit Margin 10.50% 38%
Current Ratio 1.0:1 2.0:1
Quick Ratio 0.8:1 1.0:1
Inventory Holding Period 60 days 90 days
Receivables Collection Period 58 days 60 days
Payables Payment Period 50 days 50 days
Debt to Equity Ratio 50% 30%
Dividend Yield 3% 2%
Dividend Cover 2 times 1.5 times

Required:
Write a report analyzing and comparing the financial performance of Fordland Ltd and Fiatland Ltd. The report should cover operating performance, liquidity, gearing, and investment ratios. (8 marks)

Login or create a free account to see answers

Find Related Questions by Tags, levels, etc.

Report an error

You're reporting an error for "CR – May 2018 – L3 – Q4c – Analysis and Interpretation of Financial Statements"

CR – April 2022 – L3 – Q5 – Analysis and interpretation of financial statements

Write a report analyzing the financial performance and financial position of Azure Plc using financial ratios and sector averages.

Azure Plc is a company that trades its ordinary shares on the Ghana Stock Exchange. Below are the statements of profit or loss for the year ended 31 December 2020 and for the first three quarters in 2020 published in line with the Ghana Stock Exchange regulations:

Statements of profit or loss of Azure Plc:

Description Year Ended 31 Dec 2020 (Audited) Quarter 3 (Unaudited) Quarter 2 (U

naudited)

Quarter 1 (Unaudited)
Revenue GH¢ 2,829 million GH¢ 544 million GH¢ 810 million GH¢ 624 million
Cost of sales (GH¢ 1,754 million) (GH¢ 346 million) (GH¢ 489 million) (GH¢ 412 million)
Gross profit GH¢ 1,075 million GH¢ 198 million GH¢ 321 million GH¢ 212 million
Other operating income GH¢ 72 million GH¢ 32 million GH¢ 21 million GH¢ 23 million
Administrative expenses (GH¢ 572 million) (GH¢ 94 million) (GH¢ 183 million) (GH¢ 146 million)
Distribution costs (GH¢ 265 million) (GH¢ 73 million) (GH¢ 62 million) (GH¢ 65 million)
Finance costs (GH¢ 15 million) (GH¢ 11 million) (GH¢ 2 million) (GH¢ 2 million)
Profit before tax GH¢ 295 million GH¢ 52 million GH¢ 95 million GH¢ 22 million
Tax (GH¢ 101 million) (GH¢ 17 million) (GH¢ 31 million) (GH¢ 11 million)
Profit for the year GH¢ 194 million GH¢ 35 million GH¢ 64 million GH¢ 11 million

Additional information:
The following ratios have been calculated for the relevant sector for the year ended 31 December 2020:

  • Return on year-end capital employed: 18.30%
  • Return on year-end equity: 16.05%
  • Profit (before interest and tax) margin: 12.1%
  • Gross profit margin: 43.22%
  • Current ratio: 2.60
  • Quick ratio: 1.25
  • Assets turnover: 1.02
  • Debt-to-equity ratio: 30.50%

Required:
Write a report to the Board of Directors of Azure Plc, analyzing the financial performance and financial position of the company using the above information to assist the Board in determining whether strategic adjustments are required and where, if any.
(20 marks)

Login or create a free account to see answers

Find Related Questions by Tags, levels, etc.

Report an error

You're reporting an error for "CR – April 2022 – L3 – Q5 – Analysis and interpretation of financial statements"

CR – Nov 2016 – L3 – Q4b – Analysis and interpretation of financial statements

Write a report comparing Decimal Ltd’s financial performance with industry averages in terms of profitability, liquidity, efficiency, and shareholders’ investment.

Below are the financial ratios for the year 2015 for Decimal Ltd, a company engaged in the buying and shipment of agricultural products. The ratios for the industry have also been provided.

Ratios Decimal Ltd Industry Average
Quick ratio 0.52:1 0.84:1
Current ratio 1.20:1 1.80:1
Debtors collection period 46 days 41 days
Creditors payment period 70 days 50 days
Inventory holding period 58 days 48 days
Dividend yield 3.6% 9.0%
Debt to equity 85% 45%
Dividend cover 1.4 times 3.4 times
Gross profit margin 18% 28%
Net profit margin 8% 12.8%
Return on capital employed 28% 14%
Net assets turnover 4.2 times 1.9 times

Required:
Write a report to the Shareholders of Decimal Ltd assessing its performance in comparison with the industry in respect of profitability, liquidity, efficiency, and shareholders’ investment.
(10 marks)

Login or create a free account to see answers

Find Related Questions by Tags, levels, etc.

Report an error

You're reporting an error for "CR – Nov 2016 – L3 – Q4b – Analysis and interpretation of financial statements"

CR – Nov 2016 – L3 – Q4a – Analysis and interpretation of financial statements

Describe two uses of accounting ratios and explain three limitations of their use in appraising financial performance.

It has been suggested that ratio analysis is not necessarily the best way of assessing a company’s performance.

Required:
i) Describe two uses of accounting ratios other than performance assessment. (2 marks)
ii) Explain three limitations of the use of accounting ratios in the appraisal of financial performance. (3 marks)

Login or create a free account to see answers

Find Related Questions by Tags, levels, etc.

Report an error

You're reporting an error for "CR – Nov 2016 – L3 – Q4a – Analysis and interpretation of financial statements"

PSAF – Nov 2016 – L2 – Q1a – Preparation and presentation of financial statements for central government

Prepare the Statement of Financial Performance and the Statement of Financial Position for the Consolidated Fund as of 31 December 2014 under accrual basis, in compliance with IPSAS.

Below is the Trial Balance of the Consolidated Fund for the year ended 31 December 2014.

Additional Information:
i) It is the policy of Controller and Accountant General to adopt the accrual basis of preparing the public accounts of the Consolidated Fund for the first time in compliance with the Financial Administration Regulation 2004 and the International Public Sector Accounting Standards (IPSAS). The effective date is 31 December 2014.
ii) The current Chart of Accounts based on the GFS 2001 is used in the classification of revenues and expenditures.
iii) Consumption of fixed capital charged on cost for the year has been computed as GH¢156,000,000.
iv) Direct tax revenues due to government but were not received at 31 December 2014 amounted to GH¢49,000,000.
v) An established post salary in arrears as a result of salary increment in the fourth quarter of 2014 was GH¢56,000,000 and goods and services outstanding at the end of the year amounted to GH¢12,000,000.
vi) The grant shown in the trial balance as expenditure represents a statutory transfer to the District Assembly Common Fund (DACF). Any arrears in the DACF should be treated as payable. The current rate of transfer is 7.5% on the amount received.
vii) Public debt interest of GH¢14,000,000 was due to creditors but was not paid as at 31 December 2014.

Required:
a) Prepare in a form suitable for publication and in accordance with the relevant Financial Laws and IPSAS:
i) Statement of Financial Performance of the Consolidated Fund for the year ended 31 December 2014.
ii) Statement of Financial Position of the Consolidated Fund as at 31 December 2014.
(Show all workings clearly)

b) Disclose any TWO significant accounting policies as part of the notes to your accounts, as much as the information provided will permit.

Login or create a free account to see answers

Find Related Questions by Tags, levels, etc.

Report an error

You're reporting an error for "PSAF – Nov 2016 – L2 – Q1a – Preparation and presentation of financial statements for central government"

MA – May 2020 – L2 – Q1 – Performance Analysis

Analyze and discuss VAR's performance under financial performance, internal efficiency, and external effectiveness for the year ended 31 December 2016.

Volta Advisory Ltd (VAR) began trading on 1 January 2014. It specializes in the provision of expert advice to clients in accountancy, taxation, and regulatory compliance. It has a team of professional advisors, each specializing in one of these three areas of advice.

VAR has a target for delivering its services to clients promptly. From the time the client asks for advice, VAR undertakes to provide a formal report to the client within 10 working days. The following information relates to the financial year ended 31 December 2016.

i) The professional advisors are budgeted to work 220 days each year. They charge GH¢1,400 per day to new clients and GH¢1,200 to established clients.

ii) As a marketing measure intended to win new business, the advisors also give consultations to potential clients on a ‘no fee’ basis. These consultations, which are budgeted to take one day each, are accounted for as business development costs in the marketing budget.

iii) The professional advisors are also required to attend some ‘workshops’ with new clients who are having difficulties with implementing the advice that they have been given by VAR. These workshops, which are also given on a ‘no fee’ basis, are budgeted to last two days.

iv) VAR also has a help desk to provide client support. It responds to telephone and e-mail inquiries from all new and established clients.

v) The team of professional advisors is exactly 50. It is a policy of VAR to limit the team to 50, regardless of the volume of demand for its services.

vi) All professional advisors are paid a salary of GH¢100,000 per year. In addition, they are entitled to share equally in an annual bonus. The bonus is 50% of the amount by which fee income generated exceeds budget minus the revenue foregone as a result of having to give workshops for clients. This revenue foregone is assessed at a notional daily rate of GH¢1,200 per advisor/day.

vii) Operating expenses of the business, excluding salaries of the advisors, were GH¢3,100,000 in 2016. The budget for these expenses was GH¢2,800,000.

Other information

Budget 2016 Actual 2016
Professional advisors, by category:
Accounting 15 10
Tax 20 20
Compliance 15 20
Enquiries about seeking new advice:
New clients 2,600 2,200
Established clients 4,000 3,700
Number of chargeable client days:
New clients 2,600 2,750
Established clients 5,100 5,500
Average client days per job 4 4
Mix of chargeable client days:
Accounting 1,155 1,650
Tax 1,540 3,300
Compliance 1,155 3,300

The following are actual results for each of the three years 2014-2016:

2014 2015 2016
Number of clients 160 248 347
Number of complaints from clients 50 75 95
Number of accounts in dispute 10 7 5
Support desk: percentage of calls resolved 86% 94% 97%
Percentage of jobs completed within 10 days 90% 95% 98%
Average time to complete a job (days) 12.6 10.7 9.5
Chargeable client days 7,200 7,750 8,250
Number of consultations (business development) 50 100 150
Number of workshops given 110 135 165
Revenue (GH¢000) 8,920 9,740 ?
Net profit (GH¢000) 1,740 1,940 ?

Required: Using the information provided, analyze and discuss the performance of VAR for the year to 31 December 2016, under the following headings:

a) Financial performance and competitiveness;
b) Internal efficiency;
c) External effectiveness.

Login or create a free account to see answers

Find Related Questions by Tags, levels, etc.

Report an error

You're reporting an error for "MA – May 2020 – L2 – Q1 – Performance Analysis"

MA – May 2016 – L2 – Q1b – Performance Analysis, Other Aspects of Performance Measurement

Explain methods used in measuring performance and identify qualities of good performance measurement criteria.

Performance Management aims to establish how well something or somebody is doing in relation to a plan. Explain TWO methods used in measuring performance and identify FOUR qualities of a good performance measurement criteria.

(8 marks)


Login or create a free account to see answers

Find Related Questions by Tags, levels, etc.

Report an error

You're reporting an error for "MA – May 2016 – L2 – Q1b – Performance Analysis, Other Aspects of Performance Measurement"

BMIS – March 2024 – L1 – Q2b – The business organisation and its stakeholders

Briefly discuss how shareholders, customers, suppliers, and the government may be rewarded for a company's good financial performance.

Briefly discuss how the following external stakeholder groups may be rewarded for a company’s good financial performance.

i) Shareholders ii) Customers iii) Suppliers iv) Government (4 marks)

Login or create a free account to see answers

Find Related Questions by Tags, levels, etc.

Report an error

You're reporting an error for "BMIS – March 2024 – L1 – Q2b – The business organisation and its stakeholders"

PSAF – May 2021 – L2 – Q3b – Financial statements discussion and analysis

Compute key financial ratios for two countries and analyze their financial performance and position.

Country X and Country Y are Sub-Saharan African Countries that attained independence around the same period. Presented below are the financial statements of the two countries.

Statement of Financial Performance for the year ended 31 December 2020:

Item Description Country X (GH¢ million) Country Y (GH¢ million)
Revenues
Domestic tax 39,675 25,500
International trade tax 27,300 31,995
Non-tax revenue 11,250 19,200
Grants 1,950 1,650
Total revenue 80,175 78,345
Expenditure
Compensation for employees 44,700 30,450
Use of goods and services 15,450 21,000
Consumption of fixed capital 360 420
Exchange difference 1,485 900
Interest 29,490 15,690
Subsidies 765 180
Other expenses 2,400 2,145
Total Expenditure 94,650 70,785
Net Operating Result (14,475) 7,560

Other Information:

Item Description Country X Country Y
Population 30,000,000 22,500,000
Gross Domestic Product (GDP) GH¢ 217,500,000,000 GH¢ 165,000,000,000

Statement of Financial Position as at 31 December 2020:

Item Description Country X (GH¢ million) Country Y (GH¢ million)
Non-Current Assets
Property, plant, and equipment 3,675 33,600
Equity investment 12,000 8,250
Total Non-Current Assets 15,675 41,850
Current Assets
Receivables 10,050 12,600
Cash and cash equivalent 7,050 27,000
Total Current Assets 17,100 39,600
Total Assets 32,775 81,450
Funds and Liabilities
Accumulated Fund (120,300) 7,200
Current Liabilities
Payables 9,300 6,150
Trust monies 2,100 1,350
Domestic debt 24,000 6,750
Total Current Liabilities 35,400 14,250
Non-Current Liabilities
Domestic debt 54,000 27,000
External debt 63,675 33,000
Total Non-Current Liabilities 117,675 60,000
Total Fund and Liabilities 32,775 81,450

Required:
i) From the information provided, compute for the two countries respectively:

  • Grant to Total Revenue ratio
  • Wage Bill to Tax Revenue ratio
  • Interest to Revenue ratio
  • Debt to GDP ratio
  • Capital expenditure per Capita
  • Wages bill to Total Expenditure ratio (6 marks)

ii) Based on the result in question i), write a report discussing and analyzing the financial performance and financial position of the two countries. Include in your report the limitations of the analysis of the two countries. (4 marks)

Login or create a free account to see answers

Find Related Questions by Tags, levels, etc.

Report an error

You're reporting an error for "PSAF – May 2021 – L2 – Q3b – Financial statements discussion and analysis"

Oops!

This feature is only available in selected plans.

Click on the login button below to login if you’re already subscribed to a plan or click on the upgrade button below to upgrade your current plan.

If you’re not subscribed to a plan, click on the button below to choose a plan