
Question
Answer
(a)
| Classes | Class Boundaries | Class Midpoints (x) | Frequency (f) | fx | f(x²) |
|---|---|---|---|---|---|
| 0-4 | -0.5-4.5 | 2 | 38 | 76 | 152 |
| 5-9 | 4.5-9.5 | 7 | 25 | 175 | 1,225 |
| 10-14 | 9.5-14.5 | 12 | 16 | 192 | 2,304 |
| 15-19 | 14.5-19.5 | 17 | 21 | 357 | 6,069 |
| Total | 100 | 800 | 9,796 |
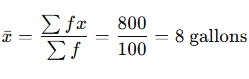
i) Mean:
ii) Median:
Median lies in the 0-4 class.
L = 4.5, N = 100 ,cf = 38, f = 25, Median=4.5+ 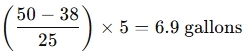
i) Inter-Quartile Range: Q3 = 13.25, Q1 = 0.16, IQR = 13.09
ii) Variance: 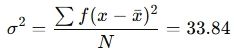
iii) Skewness:
Skewness = ![]()
(c) Comment:
The data is unimodal and positively skewed, as the mode is less than the median, and the median is less than the mean.