
Question
Answer
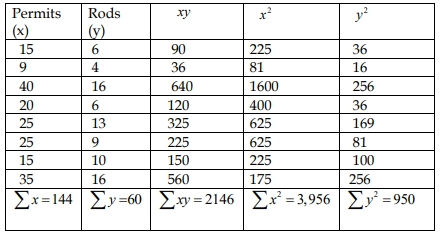
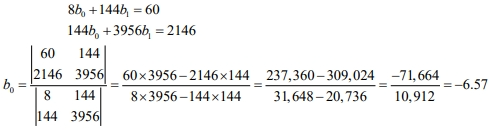
a
i)
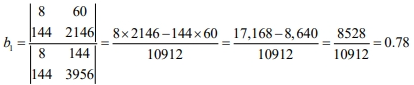
ii) on average, for each additional construction permit issued, 0.78 iron rods will be demanded.
iii) When the number of construction permits is 30: y = −0.67 + 0.78 (30) = 22.73
iv) Yes, the estimate is reliable because the value of 30 is within the range of the data used to derive the regression equation.
v) R = 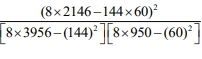
= 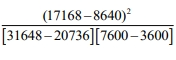
= ![]() = 0.2%
= 0.2%
This indicates that roughly 0.2% of the variation in iron rod demand is explained by the variation in construction permits.