Topic: Analysis and Interpretation of Financial Statements

Search 500 + past questions and counting.
  • Filter by Professional Bodies

  • Filter by Subject

  • Filter by Series

  • Filter by Topics

  • Filter by Levels

CR – Nov 2024 – L3 – Q5b – Financial Performance & Digital Technology Integration

Evaluating the financial performance of Nsawkaw PLC and addressing challenges of digital technology integration in accounting.

(a) Compute the following ratios for the years ended 2024 & 2023:
i) Operating profit margin
ii) Return on parent’s equity
iii) Earnings per share
iv) Current ratio
v) Trade receivables days
vi) Total liabilities to total assets %

(b) Write a report to the directors of DPEF evaluating the inter-period financial performance and position of NK using the above six (6) ratios. The report should draw attention to how the non-financial metrics combine with the financial counterparts to showcase the prospects and viability of NK.                                                                      c) The concept of double materiality is relevant to sustainability impacts and dependencies. It
incorporates financial materiality and impact materiality. 

Login or create a free account to see answers

Find Related Questions by Tags, levels, etc.

Report an error

You're reporting an error for "CR – Nov 2024 – L3 – Q5b – Financial Performance & Digital Technology Integration"

CR – Nov 2024 – L3 – Q5a – Financial Analysis and Investment Evaluation

Compute financial ratios for Nsawkaw PLC to evaluate its financial performance for investment recommendation.

Nsawkaw PLC (NK), a gold processing and trading company, has been identified by Djaraye Private Equity Fund (DPEF) as a target for long-term equity investment. As a financial consultant of DPEF, you have been tasked to evaluate the integrated financial condition of NK and make an investment recommendation.

Below are the summarised versions of NK’s Consolidated Financial Statements for the year ended June 30, 2024 (together with its comparative period):

Summarised Consolidated Statement of Profit or Loss for the year ended 30 June 2024

2024 (GH¢000) 2023 (GH¢000)
Revenue 2,538,000 2,125,000
Operational expenses (1,909,100) (1,592,900)
Interest costs (186,700) (157,250)
Taxation (234,000) (198,500)
Profit after tax 208,200 176,350
Other comprehensive income 17,900 10,550
Total comprehensive income 226,100 186,900

Summarised Consolidated Statement of Changes in Equity for the year ended 30 June 2024

Equity Holders of the Parent (GH¢000) Non-controlling Interests’ Equity (GH¢000) Total Equity (GH¢000)
2024
Balances b/d 457,200 65,600 522,800
Total comprehensive income 190,800 35,300 226,100
Dividends (110,000) (8,700) (118,700)
Balances c/d 538,000 92,200 630,200
2023
Balances b/d 355,000 46,650 401,650
Total comprehensive income 160,500 26,400 186,900
Dividends (58,300) (7,450) (65,750)
Balances c/d 457,200 65,600 522,800

Summarised Statement of Financial Position as at 30 June 2024

2024 (GH¢000) 2023 (GH¢000)
Non-current assets
Property, plant, and equipment 718,000 657,000
Others 156,000 99,000
Total Non-current assets 874,000 756,000
Current assets
Trade receivables 140,000 121,000
Others 236,500 123,050
Total Current assets 376,500 244,050
Total Assets 1,250,500 1,000,050
Total Equity and Liability 1,250,500 1,000,050

Additional information:

  1. The total number of equity shares outstanding was 1.2 million and 1.4 million at 30 June 2023 and 30 June 2024 respectively.
  2. Other comprehensive income attributable to non-controlling interests for the years ended 30 June 2023 and 2024 amounted to GH¢8.05 million and GH¢9.6 million respectively.
  3. Non-current liabilities at 30 June 2023 and 30 June 2024 amounted to GH¢250,800 and GH¢308,510 respectively.
  4. The following metrics have been gleaned from NK’s published sustainability reports across the two years:
Metric 2024 2023
Scope 1 & 2 carbon emissions (tonnes of CO2) 650 780
Scope 3 carbon emissions (tonnes of CO2) 2,400 2,380
Women in senior management (%) 21 16
Total recordable injury frequency rate (TRIFR) per 100 full-time workers 3.3 4.1

The scope and definitions of the above sustainability measures have remained materially unchanged across the two years.

Required:

Compute the following ratios for the years ended 2024 & 2023:

  1. Operating profit margin
  2. Return on parent’s equity
  3. Earnings per share
  4. Current ratio
  5. Trade receivables days
  6. Total liabilities to total assets %

Login or create a free account to see answers

Find Related Questions by Tags, levels, etc.
Report an error

You're reporting an error for "CR – Nov 2024 – L3 – Q5a – Financial Analysis and Investment Evaluation"

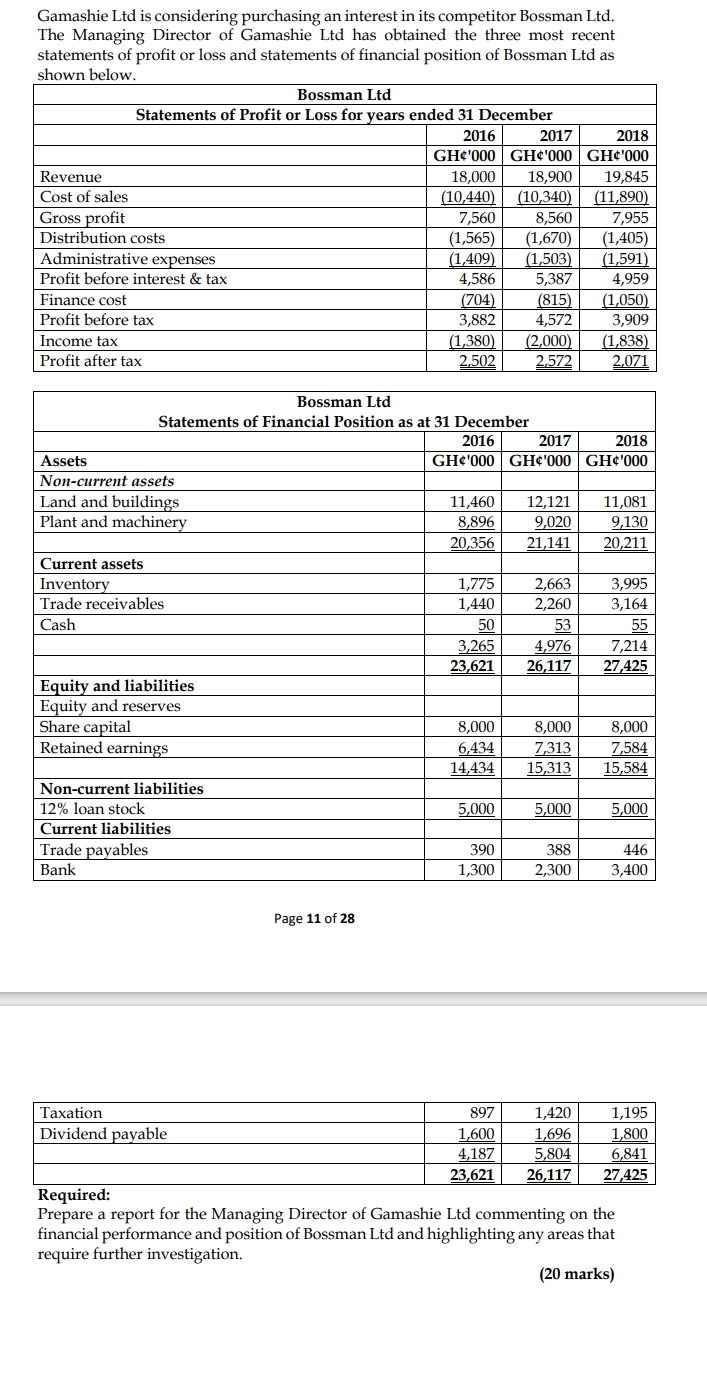
CR – May 2020 – Q5 – Financial Performance and Position of Bossman Ltd

This question involves analyzing the financial performance and position of Bossman Ltd over three years using ratio analysis.

Login or create a free account to see answers

Find Related Questions by Tags, levels, etc.

Report an error

You're reporting an error for "CR – May 2020 – Q5 – Financial Performance and Position of Bossman Ltd"

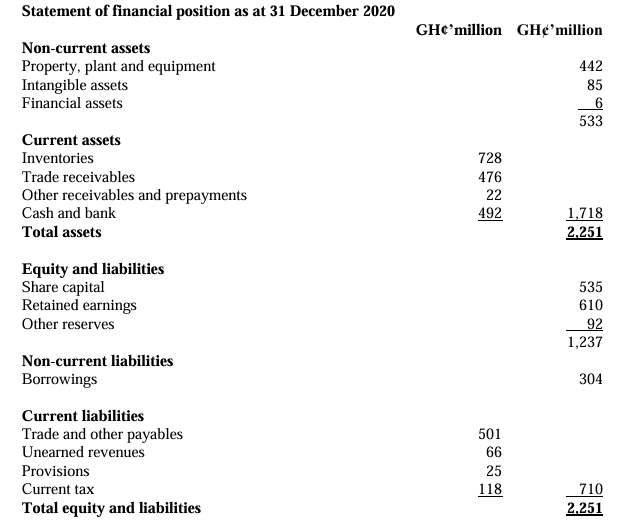
CR – Nov 2020 – L3 – Q5c – Ratios for Lenders

Calculate two ratios of interest to a potential long-term lender for two years.

Calculate, for both years, TWO (2) ratios of interest to a potential long-term lender.


Login or create a free account to see answers

Find Related Questions by Tags, levels, etc.
Report an error

You're reporting an error for "CR – Nov 2020 – L3 – Q5c – Ratios for Lenders"

CR – Nov 2020 – L3 – Q5a – Return on Equity & Return on Capital Employed

Calculate and interpret return on equity and return on capital employed for Bounce Back Ltd for two years.

Bounce Back Ltd Financial Information:

Statement of Comprehensive Income for the year ended 30 November:

2019 2018
Profit before interest and tax GH¢2,200,000 GH¢1,570,000
Interest expense (GH¢170,000) (GH¢150,000)
Profit before tax GH¢2,030,000 GH¢1,420,000
Taxation (GH¢730,000) (GH¢520,000)
Profit after tax GH¢1,300,000 GH¢900,000
Dividends paid (GH¢250,000) (GH¢250,000)
Retained profit GH¢1,050,000 GH¢650,000

Statement of Financial Position as at 30 November:

2019 2018
Non-current assets (written-down value) GH¢6,350,000 GH¢5,600,000
Current assets
Trade receivables GH¢2,100,000 GH¢2,070,000
Inventories GH¢1,710,000 GH¢1,540,000
Total current assets GH¢3,810,000 GH¢3,610,000
Creditors: amounts due within one year
Trade payables GH¢1,040,000 GH¢1,130,000
Taxation GH¢550,000 GH¢450,000
Bank overdraft GH¢370,000 GH¢480,000
Total current liabilities GH¢1,960,000 GH¢2,060,000
Net current assets GH¢1,850,000 GH¢1,550,000
Total net assets GH¢8,200,000 GH¢7,150,000
Creditors: amounts due after more than one year
10% debentures GH¢1,500,000 GH¢1,500,000
Equity
Share capital (ordinary shares of 50p fully paid up) GH¢3,000,000 GH¢3,000,000
Retained earnings GH¢3,700,000 GH¢2,650,000
Total equity GH¢6,700,000 GH¢5,650,000
Total long-term liabilities and equity GH¢8,200,000 GH¢7,150,000

Required:

  1. Calculate, for both years, the return on equity and the return on capital employed.

Login or create a free account to see answers

Find Related Questions by Tags, levels, etc.
Report an error

You're reporting an error for "CR – Nov 2020 – L3 – Q5a – Return on Equity & Return on Capital Employed"

CR – Nov 2020 – L3 – Q5b – Investment Ratios

Calculate two investment ratios of interest to a potential investor for two years.

Calculate, for both years, TWO (2) investment ratios of interest to a potential investor.


Login or create a free account to see answers

Find Related Questions by Tags, levels, etc.
Report an error

You're reporting an error for "CR – Nov 2020 – L3 – Q5b – Investment Ratios"

CR – Nov 2020 – L3 – Q5d – Performance Analysis

Report on the performance and state of the business using calculated ratios from the viewpoint of shareholders and lenders.

Report on the performance and state of the business from the viewpoint of a potential shareholder and lender using the ratios calculated above and explain any weaknesses in these ratios.


Login or create a free account to see answers

Find Related Questions by Tags, levels, etc.
Report an error

You're reporting an error for "CR – Nov 2020 – L3 – Q5d – Performance Analysis"

CR – May 2021 – L3 – Q5 – Financial performance of Shop First Ltd

Analyze the financial performance of Shop First Ltd for 2020 and discuss the effects of discontinued operations and contingencies.

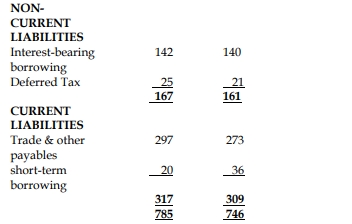
Shop First Ltd operates supermarket chains across the sixteen (16) regions of Ghana. The firm has been in commercial operation for more than two decades, growing its operations through an effective supply chain and financial management. However, in the last few years, keen competition and worsening general economic performance have steadied the consistent growths experienced over the years, resulting in the entity disposing off part of its operations. Below are the financial statements of Shop First Ltd:

Login or create a free account to see answers

Find Related Questions by Tags, levels, etc.
Report an error

You're reporting an error for "CR – May 2021 – L3 – Q5 – Financial performance of Shop First Ltd"

CR – May 2019 – L3 – Q4 – Analysis and interpretation of financial statements

The question requires calculation of financial ratios and analysis of the financial performance and cash position of Madina Ltd for the year ended 30 September 2018.

Below are the recently issued financial statements of Madina Ltd, a listed company, for the year ended 30 September 2018, together with comparatives for 2017.

Statement of Profit or Loss for the year ended 30 September:

Details 2018 (GH¢’000) 2017 (GH¢’000)
Revenue 125,000 90,000
Cost of Sales (100,000) (75,000)
Gross Profit 25,000 15,000
Operating Expenses (13,000) (11,000)
Finance Costs (4,000)
Profit before Tax 8,000 4,000
Tax (at 25%) (2,000) (1,000)
Profit for the year 6,000 3,000

Statement of Financial Position as at 30 September:

Details 2018 (GH¢’000) 2017 (GH¢’000)
Non-Current Assets
Property, Plant, and Equipment 105,000 45,000
Goodwill 5,000
Total Non-Current Assets 110,000 45,000
Current Assets
Inventory 12,500 7,500
Receivables 6,500 4,000
Bank 7,000
Total Current Assets 19,000 18,500
Total Assets 129,000 63,500
Equity and Liabilities
Equity
Share Capital 50,000 50,000
Retained Earnings 7,000 6,000
Total Equity 57,000 56,000
Non-Current Liabilities
8% Loan Notes 50,000
Current Liabilities
Bank Overdraft 8,500
Trade Payables 11,500 6,500
Current Tax Payable 2,000 1,000
Total Current Liabilities 22,000 7,500
Total Equity and Liabilities 129,000 63,500

Additional Information:

  • On 1 October 2017, Madina Ltd acquired 100% of the net assets of Aboabu Ltd for GH¢50 million. In order to finance this transaction, Madina Ltd issued GH¢50 million 8% loan notes on the acquisition date.
    Aboabu Ltd’s results for the year ended 30 September 2018 are shown below:

Aboabu Ltd’s Statement of Profit or Loss for the year ended 30 September:

Details GH¢’000
Revenue 35,000
Cost of Sales (20,000)
Gross Profit 15,000
Operating Expenses (4,000)
Profit before Tax 11,000
Tax (at 25%) (2,750)
Profit for the year 8,250
  • Aboabu Ltd has not paid any dividend during the year, but Madina Ltd paid a dividend of GH¢0.05 per share.
  • The following ratios have been calculated for Madina Ltd for the year ended 30 September 2017:
    • Return on capital employed: 7.1%
    • Gross profit margin: 16.7%
    • Net profit (before tax) margin: 4.4%

Required:

a) Calculate the equivalent ratios for Madina Ltd for 2018:
i) Including the results of Aboabu Ltd acquired during the year. (3 marks)
ii) Excluding all effects of the purchase of Aboabu Ltd. (3 marks)

b) Analyse the performance of Madina Ltd for the year ended 30 September 2018. (5 marks)

c) Analyse the cash position of Madina Ltd as at 30 September 2018. (4 marks)

Login or create a free account to see answers

Find Related Questions by Tags, levels, etc.
Report an error

You're reporting an error for "CR – May 2019 – L3 – Q4 – Analysis and interpretation of financial statements"

CR – May 2018 – L3 – Q4c – Analysis and Interpretation of Financial Statements

Analyze and compare the financial performance of two companies in terms of operating performance, liquidity, gearing, and investment ratios.

Fordland Ltd and Fiatland Ltd are two companies in the garment industry. The following are financial ratios computed by the Research Department of ICAG as part of analyzing companies’ performance industry by industry:

Ratios Fordland Ltd Fiatland Ltd
Return on Capital Employed (ROCE) 24.10% 30%
Net Assets Turnover 1.9 times 2.5 times
Gross Profit Margin 35% 20%
Net Profit Margin 10.50% 38%
Current Ratio 1.0:1 2.0:1
Quick Ratio 0.8:1 1.0:1
Inventory Holding Period 60 days 90 days
Receivables Collection Period 58 days 60 days
Payables Payment Period 50 days 50 days
Debt to Equity Ratio 50% 30%
Dividend Yield 3% 2%
Dividend Cover 2 times 1.5 times

Required:
Write a report analyzing and comparing the financial performance of Fordland Ltd and Fiatland Ltd. The report should cover operating performance, liquidity, gearing, and investment ratios. (8 marks)

Login or create a free account to see answers

Find Related Questions by Tags, levels, etc.

Report an error

You're reporting an error for "CR – May 2018 – L3 – Q4c – Analysis and Interpretation of Financial Statements"

CR – April 2022 – L3 – Q5 – Analysis and interpretation of financial statements

Write a report analyzing the financial performance and financial position of Azure Plc using financial ratios and sector averages.

Azure Plc is a company that trades its ordinary shares on the Ghana Stock Exchange. Below are the statements of profit or loss for the year ended 31 December 2020 and for the first three quarters in 2020 published in line with the Ghana Stock Exchange regulations:

Statements of profit or loss of Azure Plc:

Description Year Ended 31 Dec 2020 (Audited) Quarter 3 (Unaudited) Quarter 2 (U

naudited)

Quarter 1 (Unaudited)
Revenue GH¢ 2,829 million GH¢ 544 million GH¢ 810 million GH¢ 624 million
Cost of sales (GH¢ 1,754 million) (GH¢ 346 million) (GH¢ 489 million) (GH¢ 412 million)
Gross profit GH¢ 1,075 million GH¢ 198 million GH¢ 321 million GH¢ 212 million
Other operating income GH¢ 72 million GH¢ 32 million GH¢ 21 million GH¢ 23 million
Administrative expenses (GH¢ 572 million) (GH¢ 94 million) (GH¢ 183 million) (GH¢ 146 million)
Distribution costs (GH¢ 265 million) (GH¢ 73 million) (GH¢ 62 million) (GH¢ 65 million)
Finance costs (GH¢ 15 million) (GH¢ 11 million) (GH¢ 2 million) (GH¢ 2 million)
Profit before tax GH¢ 295 million GH¢ 52 million GH¢ 95 million GH¢ 22 million
Tax (GH¢ 101 million) (GH¢ 17 million) (GH¢ 31 million) (GH¢ 11 million)
Profit for the year GH¢ 194 million GH¢ 35 million GH¢ 64 million GH¢ 11 million

Additional information:
The following ratios have been calculated for the relevant sector for the year ended 31 December 2020:

  • Return on year-end capital employed: 18.30%
  • Return on year-end equity: 16.05%
  • Profit (before interest and tax) margin: 12.1%
  • Gross profit margin: 43.22%
  • Current ratio: 2.60
  • Quick ratio: 1.25
  • Assets turnover: 1.02
  • Debt-to-equity ratio: 30.50%

Required:
Write a report to the Board of Directors of Azure Plc, analyzing the financial performance and financial position of the company using the above information to assist the Board in determining whether strategic adjustments are required and where, if any.
(20 marks)

Login or create a free account to see answers

Find Related Questions by Tags, levels, etc.
Report an error

You're reporting an error for "CR – April 2022 – L3 – Q5 – Analysis and interpretation of financial statements"

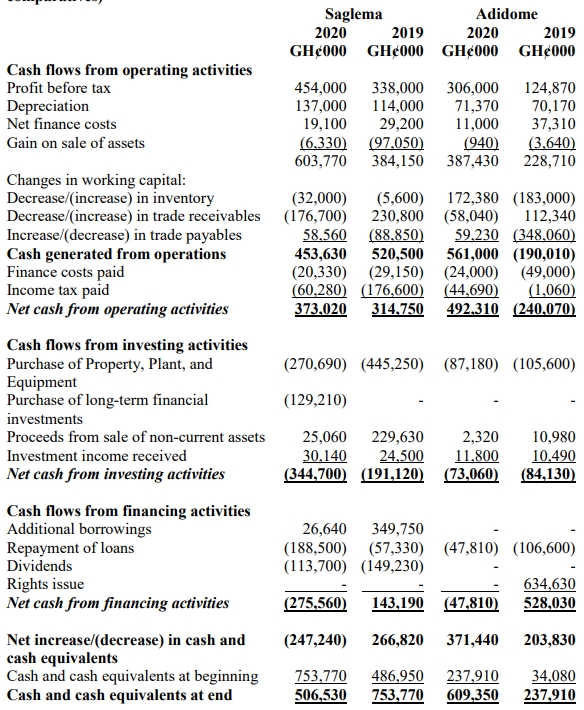
CR – Nov 2021 – L3 – Q5 – Analysis and Interpretation of Financial Statements

Produce a report analyzing the cash flow performance of Saglema Plc relative to a competitor over two years and explain the uses and limitations of cash flow analysis.

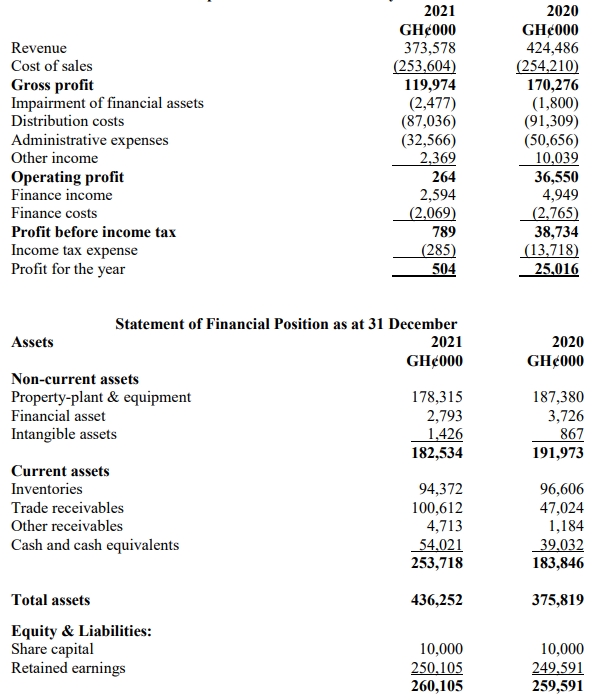
You are the Senior Financial Accountant at Saglema Plc (Saglema), a company that manufactures and sells painting materials in the local market and around the West African sub-region. At the first one-on-one meeting with the recently appointed chairperson of your company’s governing board, she asked you to produce a concise report on Saglema’s cash flow performance relative to that of Adidome Plc (Adidome), a close competitor, over the last two years.

The following are the cash flow statements for the last two years for Saglema and Adidome:

Cash Flow Statements for the Year Ended 31 August 2020 (together with comparatives):

Required:

i) Produce a report showing the comparative analysis of the cash flow performance and situation of Saglema over the last two years, relative to that of Adidome. (15 marks)
ii) Explain TWO (2) uses and THREE (3) limitations of such analysis. (5 marks)

Login or create a free account to see answers

Find Related Questions by Tags, levels, etc.
Report an error

You're reporting an error for "CR – Nov 2021 – L3 – Q5 – Analysis and Interpretation of Financial Statements"

CR – May 2016 – L3 – Q5b – Analysis and interpretation of financial statements

Evaluate significance of various accounting items

Evaluate with examples, the significance of each of the following to an analyst seeking to estimate the effect on future cash flows or liquidity of a company:
i) a commitment and a contingent liability. (2 marks)
ii) income in advance and a deposit (1.5 marks)
iii) an accrual and a provision (1.5 marks)

Login or create a free account to see answers

Find Related Questions by Tags, levels, etc.
Report an error

You're reporting an error for "CR – May 2016 – L3 – Q5b – Analysis and interpretation of financial statements"

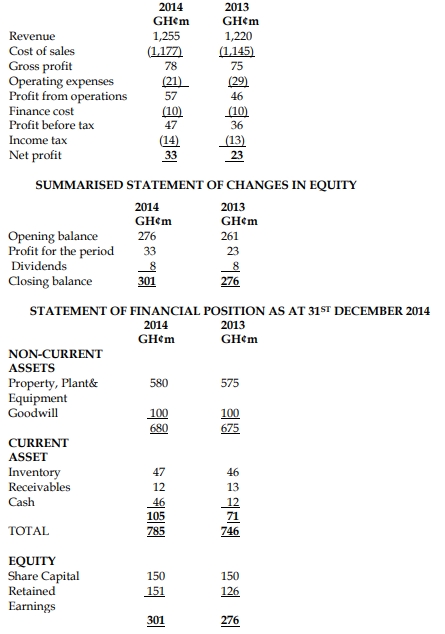
CR – May 2016 – L3 – Q5a – Analysis and interpretation of financial statements

Analyze performance and position of a supermarket chain, addressing concerns about potential financial statement manipulationEvaluate significance of various accounting items.

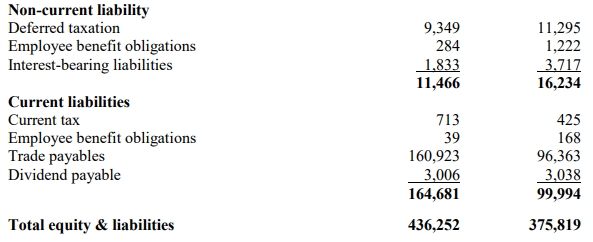
Mion Ltd is a listed company in Ghana and operates many super markets in Ghana. During the year 2014, there was speculation in the financial press that the entity was likely to be a takeover target for larger companies in Ghana. A recent newspaper publication has suggested that the directors are unlikely to resist a takeover. The seven member board are all nearing retirement and all own significant minority shareholdings in the business.

You have been approached by a private shareholder in Mion Ltd. She is concerned that the directors have conflict of interests and that financial statements for 2014 may have been manipulated. The income statement and summarized statement of changes in equity of Mion together with comparatives for the year ended 31st December 2014 and a statement of financial position as at that date are given below:

INCOME STATEMENT FOR THE YEAR ENDED 31ST DECEMBER 2014

The following additional information is relevant:

i) Non-current asset turnover (including both tangible and intangible non-current asset): 1.93 ii) Mion Ltd’s directors have undertaken a reassessment of useful lives of non-current tangible assets during the year. In most cases they estimate that the useful lives have increased and the depreciation charges in 2014 have been adjusted accordingly. iii) Six new stores have been opened during 2014, bringing the total to 42. iv) Three key ratios for the supermarket sector (based on the latest available financial statement of 12 listed entities in the sector) are as follows:

  • Annual sales per store: GH¢27.6m
  • Gross Profit margin: 5.9%
  • Net profit margin: 3.9%

Required:
Prepare a report and address to the investor, analyzing the performance and position of Mion Ltd based on the financial statements and supplementary information provided above. The report should also include comparisons with key sector ratios, and it should address the investor’s concerns about the possible manipulation of the 2014 financial statements. (15 marks)

Login or create a free account to see answers

Find Related Questions by Tags, levels, etc.

Report an error

You're reporting an error for "CR – May 2016 – L3 – Q5a – Analysis and interpretation of financial statements"

CR – Nov 2023 – L3 – Q5 – Analysis and interpretation of financial statements

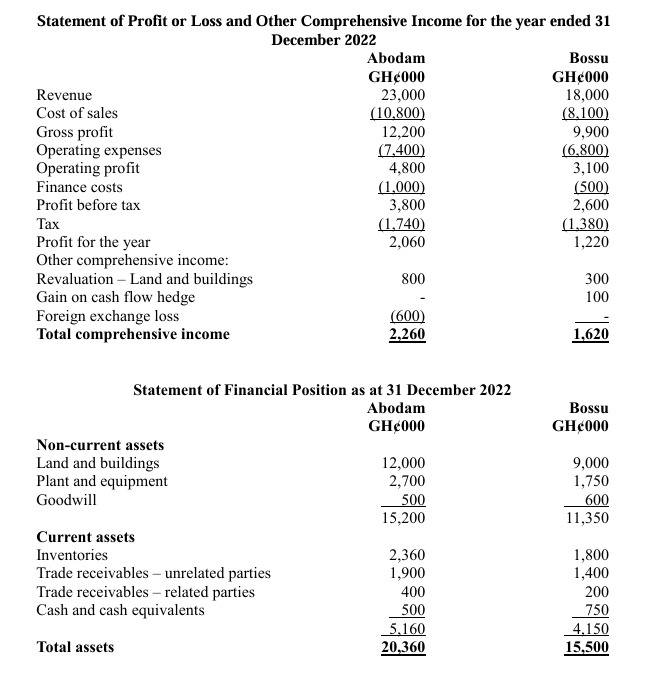
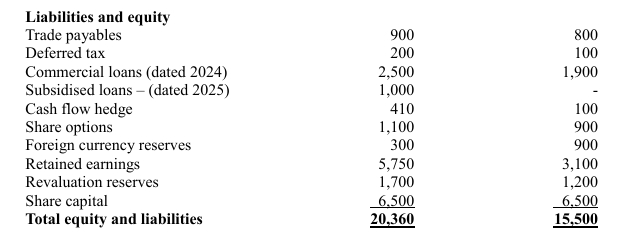
Analyze and compare the financial performance and position of two companies, Abodam Plc and Bossu Plc, using various financial ratios and metrics.

You are a financial consultant of Synel Investments (SI). The Directors of SI have tasked you to evaluate the financial health of two wholesaling companies – Abodam Plc (Abodam) and Bossu Plc (Bossu) – to help them decide which entity to invest in. Assume that all other factors of the two companies have been considered except their current period’s relative financial performance and position. The financial statements of Abodam and Bossu for the year ended 31 December 2022 are provided below:

Additional information:

  1. The Directors of Bossu announced at the beginning of the current period to repurchase 20% of the company’s issued shares in equal proportion over a three-year period. The purchase of the first tranche is expected to occur around February 2023. At the start of second quarter this year, the major commercial lender of Abodam triggered its covenant modification right to include stricter profit-based clauses in the loan agreement.

  1. During the year, Abodam and Bossu paid ordinary dividends of GH¢450,000 and GH¢315,000 respectively.
  2. Average borrowing rate for the two companies has remained 11% during the period.

Required:

a) Compute the following additional ratios for the two companies:

i) Return on year-end equity

ii) Return on year-end capital employed (where capital employed equals total assets less current liabilities)

iii) Trade receivables days

iv) Debt-to-equity

(8 marks)

b) Write a report to the board of SI to evaluate the relative financial performance and position of Abodam and Bossu, based on the following headings:

i) Profitability

ii) Working capital management

iii) Gearing

iv) Earnings per share

v) Bossu’s repurchase plan vi) Abodam’s loan covenant

(12 marks)

(Total: 20 marks)

Login or create a free account to see answers

Find Related Questions by Tags, levels, etc.

Report an error

You're reporting an error for "CR – Nov 2023 – L3 – Q5 – Analysis and interpretation of financial statements"

CR – Mar 2024 – Q5 – Analysis and interpretation of financial statements

Analyze and compare cash flow statements of two companies to recommend an investment choice between them.

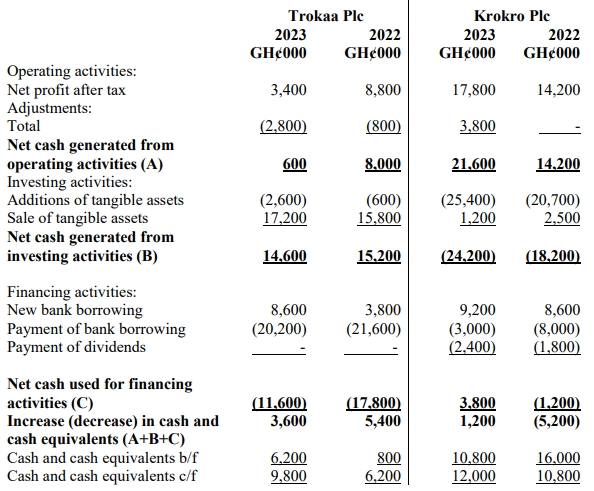
You are the Financial Consultant of Nkoso Funds, a pension fund in Ghana. Your company has identified two companies which you have been asked to evaluate as possible investments. The two companies, Trokaa Plc (Trokaa Plc) and Krokro Plc (Krokro Plc), are both publicly held and similar in size. Assume that all other publicly available information, including all climate, sustainability, and governance disclosures, have already been analysed and the decision concerning which company’s shares to acquire depends on their cash flow data given below:

Statement of cash flows for the years ended December 31, 2023 and 2022 Trokaa Plc Krokro Plc

Required:
a) Conduct a horizontal analysis for each of the two companies. (6 marks)

b) Write a report to the investment manager of Nkoso Funds discussing the relative strengths and weaknesses of each of the two companies. Conclude your report by recommending one company’s share as an investment avenue. (14 marks)

Login or create a free account to see answers

Find Related Questions by Tags, levels, etc.

Report an error

You're reporting an error for "CR – Mar 2024 – Q5 – Analysis and interpretation of financial statements"

CR – Aug 2022 – L3 – Q5 – Analysis and interpretation of financial statements

This question requires writing a report that assesses the comparative performance of a company using various financial ratios (profitability, liquidity, efficiency, and gearing).

Wadie Ltd has been in operation for the past ten years. The company started operations in Kumasi with just three employees, but currently operates in all regions of Ghana, with over five hundred employees.

The final meeting for the year of the Board of Directors of the company is to be convened, and as a tradition, the Finance Manager presented an analysis of the financial performance of the company for the financial year ended 31 December 2021. Below are the financial statements for the year ended 31 December 2021:

Statement of Comprehensive Income for the year 31 December

Additional Information:

i) Finance income relates to interest earned on the company’s investment in Government of Ghana loan notes.

ii) Dividend payable represents the dividend declared or approved by shareholders at the last Annual General Meeting.

Required:

As the Finance Manager of the company, write a report to the Board of Directors, assessing the comparative performance of the company for the year ended 31 December 2021. Your report should use THREE (3) profitability ratios, TWO (2) liquidity ratios, THREE (3) efficiency ratios, and TWO (2) gearing ratios.


Login or create a free account to see answers

Find Related Questions by Tags, levels, etc.

Report an error

You're reporting an error for "CR – Aug 2022 – L3 – Q5 – Analysis and interpretation of financial statements"

CR – Nov 2019 – L3 – Q5 – Analysis and Interpretation of Financial Statements

Analyze the financial performance of Pep Ltd over the past three years and recommend areas for further investigation.

You are the Financial Controller of Oxtom Ltd. Pep Ltd is a competitor in the same industry and has been operating for 20 years. Summaries of Pep Ltd’s Statements of Profit or Loss and Financial Position for the previous three years are given below:

Pep Ltd – Summarised Statement of Profit or Loss for the year ended 31 December

Item 2016 (GH¢’m) 2017 (GH¢’m) 2018 (GH¢’m)
Revenue 840 981 913
Cost of sales (554) (645) (590)
Gross profit 286 336 323
Selling, distribution, and admin expenses (186) (214) (219)
Profit before interest and taxes 100 122 104
Finance cost (6) (15) (19)
Profit before taxation 94 107 85
Taxation (45) (52) (45)
Profit after taxation 49 55 40
Dividends 24 24 24

Pep Ltd – Summarised Statement of Financial Position as at 31 December

Item 2016 (GH¢’m) 2017 (GH¢’m) 2018 (GH¢’m)
Assets
Non-current assets
Intangible assets 36 40 48
Tangible assets (net) 176 206 216
Total non-current assets 212 246 264
Current assets
Inventories 237 303 294
Receivables 105 141 160
Bank 52 58 52
Total current assets 394 502 506
Total assets 606 748 770
Equity and Liabilities 2016 (GH¢’m) 2017 (GH¢’m) 2018 (GH¢’m)
Equity
Stated capital 100 100 100
Retained earnings 299 330 346
Total equity 399 430 446
Non-current liabilities
Long-term loans 74 138 138
Current liabilities
Trade payables 53 75 75
Other payables 80 105 111
Total equity and liabilities 606 748 770

Required:
a) Write a report to the Chief Executive Officer of Oxtom Ltd analyzing the performance of Pep Ltd, showing any calculations in an appendix to the report. (14 marks)
b) Summarize THREE (3) areas which require further investigation, including reference to other pieces of information that would complement your analysis of Pep Ltd’s performance. (6 marks)

Login or create a free account to see answers

Find Related Questions by Tags, levels, etc.

Report an error

You're reporting an error for "CR – Nov 2019 – L3 – Q5 – Analysis and Interpretation of Financial Statements"

CR – Nov 2016 – L3 – Q4b – Analysis and interpretation of financial statements

Write a report comparing Decimal Ltd’s financial performance with industry averages in terms of profitability, liquidity, efficiency, and shareholders’ investment.

Below are the financial ratios for the year 2015 for Decimal Ltd, a company engaged in the buying and shipment of agricultural products. The ratios for the industry have also been provided.

Ratios Decimal Ltd Industry Average
Quick ratio 0.52:1 0.84:1
Current ratio 1.20:1 1.80:1
Debtors collection period 46 days 41 days
Creditors payment period 70 days 50 days
Inventory holding period 58 days 48 days
Dividend yield 3.6% 9.0%
Debt to equity 85% 45%
Dividend cover 1.4 times 3.4 times
Gross profit margin 18% 28%
Net profit margin 8% 12.8%
Return on capital employed 28% 14%
Net assets turnover 4.2 times 1.9 times

Required:
Write a report to the Shareholders of Decimal Ltd assessing its performance in comparison with the industry in respect of profitability, liquidity, efficiency, and shareholders’ investment.
(10 marks)

Login or create a free account to see answers

Find Related Questions by Tags, levels, etc.

Report an error

You're reporting an error for "CR – Nov 2016 – L3 – Q4b – Analysis and interpretation of financial statements"

CR – Nov 2016 – L3 – Q4a – Analysis and interpretation of financial statements

Describe two uses of accounting ratios and explain three limitations of their use in appraising financial performance.

It has been suggested that ratio analysis is not necessarily the best way of assessing a company’s performance.

Required:
i) Describe two uses of accounting ratios other than performance assessment. (2 marks)
ii) Explain three limitations of the use of accounting ratios in the appraisal of financial performance. (3 marks)

Login or create a free account to see answers

Find Related Questions by Tags, levels, etc.

Report an error

You're reporting an error for "CR – Nov 2016 – L3 – Q4a – Analysis and interpretation of financial statements"

Oops!

This feature is only available in selected plans.

Click on the login button below to login if you’re already subscribed to a plan or click on the upgrade button below to upgrade your current plan.

If you’re not subscribed to a plan, click on the button below to choose a plan