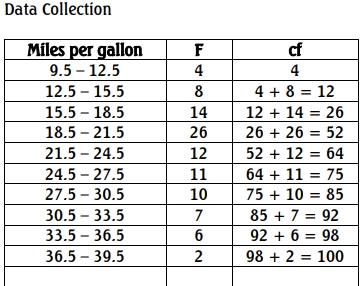
In a particular organisation, an experiment which was conducted to determine the gasoline mileage of a particular type of car yielded the following data:
Miles per gallon
Percent
10 and under 12
4
13 and under 15
8
16 and under 18
14
19 and under 21
26
22 and under 24
12
25 and under 27
11
28 and under 30
10
31 and under 33
7
34 and under 36
6
37 and under 39
2
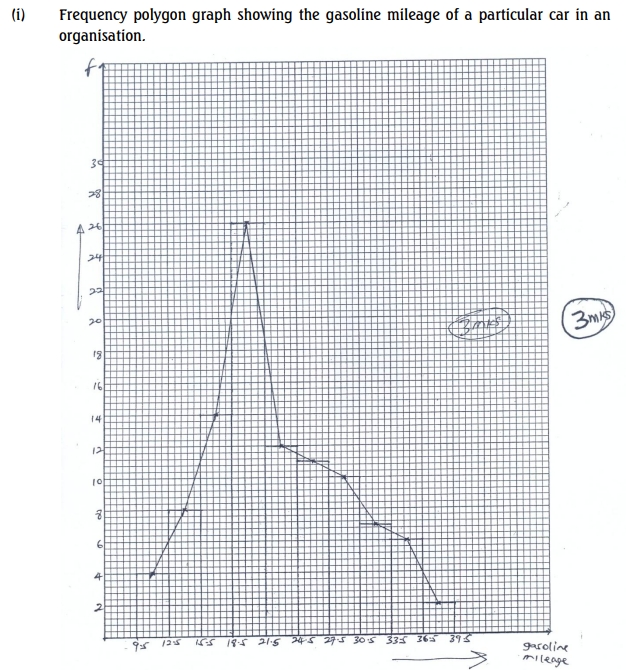
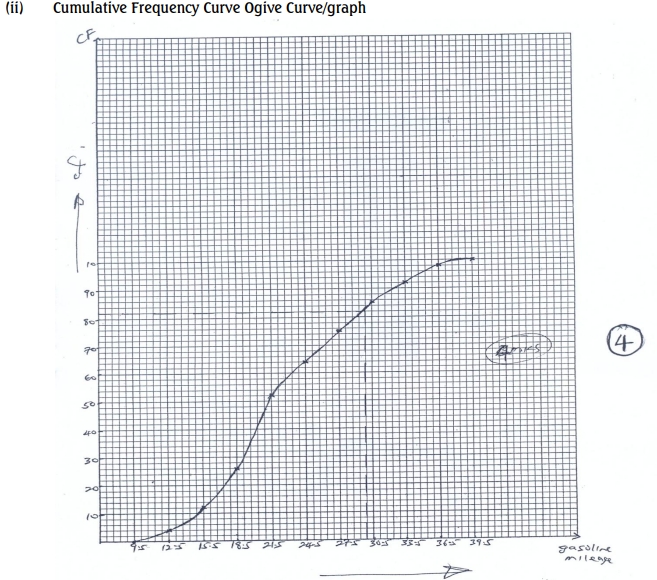
Required:
i. Draw the frequency polygon for gasoline mileage. (5 Marks) ii. Draw the ogive for gasoline mileage. (5 Marks)