
Question
Answer
E
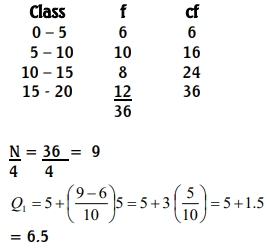
Explanation: The correct answer is E. To calculate the first quartile (Q1), we use the formula for grouped data:
E
Explanation: The correct answer is E. To calculate the first quartile (Q1), we use the formula for grouped data: