
Question
Answer
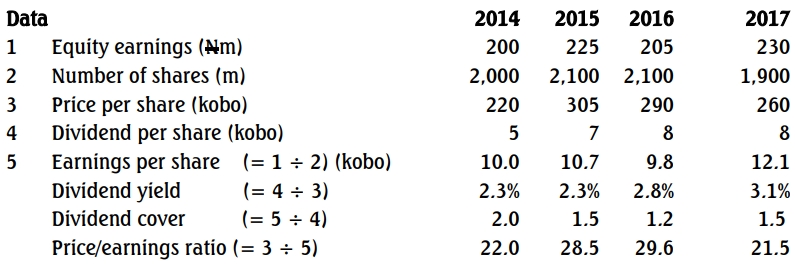
a)
Explanations of Ratios
- Earnings Per Share (EPS):
- Indicates the profit earned per share. Higher EPS often attracts investors.
- Limitations: Ignores debt levels and other qualitative factors.
- Dividend Yield:
- Reflects the return on investment via dividends. Investors seeking regular income prefer high yields.
- Limitations: Does not account for capital gains or stock price volatility.
- Dividend Cover:
- Measures how well earnings cover dividends. A higher ratio indicates retained profits for growth.
- Limitations: Ignores company-specific policies or market expectations.
- P/E Ratio:
- Shows how much investors are willing to pay per unit of earnings. High ratios indicate growth expectations.
- Limitations: Does not consider market conditions or sector variations.
b. Analysis of Changes Over Four Years
- EPS Variability:
- 2015: EPS rose due to increased earnings and share issuance.
- 2016: EPS declined despite stable earnings due to a larger share base.
- 2017: Significant EPS growth resulted from reduced shares post-buyback.
- Dividend Yield Increase:
- 2016-2017: Higher yields reflect steady dividends against declining stock prices, attracting income-focused investors.
- Dividend Cover Decline:
- Indicates increased dividend payout relative to earnings in 2016, but a rebound occurred in 2017.
- P/E Ratio Fluctuations:
- 2015-2016: Increased due to rising prices, signaling market confidence.
- 2017: Decline due to reduced price, indicating caution or lower growth expectations.
These changes may be due to evolving investor sentiment, share buybacks, dividend policies, or earnings management practices.