Question Tag: Financial Ratios

Search 500 + past questions and counting.
  • Filter by Professional Bodies

  • Filter by Subject

  • Filter by Series

  • Filter by Topics

  • Filter by Levels

FA – Nov 2024 – L1 – Q5c – Profitability vs Liquidity Ratios

Explain the difference between profitability and liquidity ratios and provide two examples of each.

Accounting ratios cover a wide array of ratios that are used by accountants and act as different indicators that measure profitability, liquidity, and potential financial distress in a company’s financials.

Required:

Differentiate between profitability ratios and liquidity ratios and give TWO examples each.

Login or create a free account to see answers

Find Related Questions by Tags, levels, etc.

Report an error

You're reporting an error for "FA – Nov 2024 – L1 – Q5c – Profitability vs Liquidity Ratios"

CR – May 2015 – L3 – Q3 – Emerging Trends in Corporate Reporting

Analyze financial statements of two companies and discuss limitations of ratio analysis.

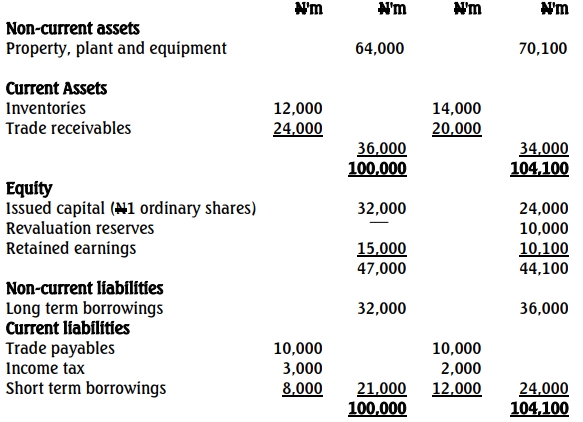
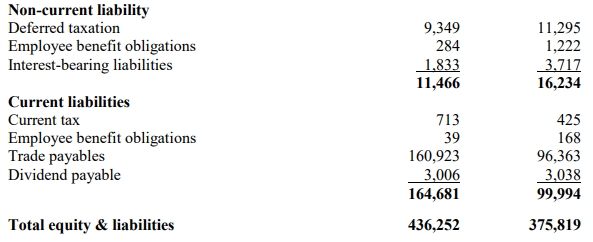
Real Expansion Plc is a large group that seeks to grow by acquisition. The directors have identified two potential entities and obtained copies of their financial statements. The accountant of the company computed key ratios to evaluate the performance of these companies relating to:

  • Profitability and returns;
  • Efficiency in the use of assets;
  • Corporate leverage; and
  • Investor-based decisions.

The computation generated hot arguments among the directors, and they decided to engage a Consultant to provide expert advice on which company to acquire.

Extracts from these financial statements are given below:

Required:

(a) As the Consultant to the company, carry out a financial analysis on the financial statements and advise the company appropriately. (15 Marks)

(b) State the major limitations of ratio analysis for performance evaluation. (5 Marks)

Login or create a free account to see answers

Find Related Questions by Tags, levels, etc.

Report an error

You're reporting an error for "CR – May 2015 – L3 – Q3 – Emerging Trends in Corporate Reporting"

FM – Nov 2016 – L3 – SC – Q6 – Strategic Performance Measurement

Evaluate Osamco Limited’s financial performance compared to industry benchmarks and discuss reasons for considering stock exchange listing.

Osamco Limited, manufacturer of wire and cables, was bought from its conglomerate parent company in a management buyout deal in August 2010. Six years later, the managers are considering the possibility of listing the company’s shares on the Nigerian Stock Exchange.

The following information is made available:

OSAMCO LIMITED
INCOME STATEMENT FOR THE YEAR ENDED JUNE 30, 2016

N’million Amount
Turnover 91.25
Cost of sales (79.00)
Profit before interest and taxation 12.25
Interest (3.25)
Profit before taxation 9.00
Taxation (1.25)
Profit attributable to ordinary shareholders 7.75
Dividend (0.75)
Retained profit 7.00

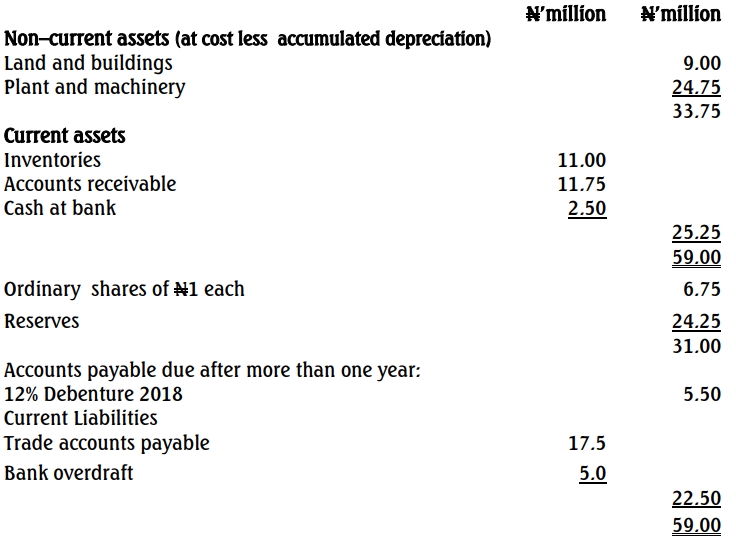
STATEMENT OF FINANCIAL POSITION AS AT JUNE 30, 2016

N’million Amount
Non-current assets (at cost less accumulated depreciation)
Land and buildings 9.00
Plant and machinery 24.75
Total non-current assets 33.75
Current assets
Inventories 11.00
Accounts receivable 11.75
Cash at bank 2.50
Total current assets 25.25
Total assets 59.00
Equity
Ordinary shares of N1 each 6.75
Reserves 24.25
Total equity 31.00
Non-current liabilities
Accounts payable due after more than one year: 12% Debenture 2018 5.50
Current liabilities
Trade accounts payable 17.50
Bank overdraft 5.00
Total current liabilities 22.50
Total equity and liabilities 59.00

Industry sector ratios:

Metric Industry Average
Return before interest and tax on long-term capital employed 24%
Return after tax on equity 16%
Operating profit as percentage of sales 11%
Current ratio 1.6:1
Quick (acid test) ratio 1.0:1
Total debt: equity (gearing) 24%
Dividend cover 4.0
Interest cover 4.5

Required:
a. Evaluate the financial state and performance of Osamco Limited by comparing it with that of its industry sector. (10 Marks)

b. Discuss FOUR probable reasons why the management of Osamco Limited is considering Stock Exchange listing. (5 Marks)

Login or create a free account to see answers

Find Related Questions by Tags, levels, etc.

Report an error

You're reporting an error for "FM – Nov 2016 – L3 – SC – Q6 – Strategic Performance Measurement"

FM – May 2017 – L3 – Q4 – Financing Decisions and Capital Markets

Analyze and propose the use of convertible bonds for funding a warehouse project.

You are a financial consultant to a major company based in Kano. The company plans to build a major warehouse in Abuja. You plan to convince the company’s manager to raise the needed funds through a convertible bond issue. Based on the company’s current bond rating of BBB, you have projected the following offer terms:

  • Maturity: 6 years
  • Annual Coupon: 1%
  • Conversion Ratio: 50 shares
  • Par Value per Bond: ₦1,000
  • Issue Price: 98% of par value
  • Current Stock Price: ₦16
  • Risk-free Rate: 0.5%
  • Coupon on Straight Bonds: 2% (trading at par)

The proposal suggests raising up to ₦20,000,000. However, with key financial ratios close to the boundaries of the rating category, offering the full amount could threaten the BBB rating.

Given an average business risk profile, the following rating guidelines apply:

Rating Category Minimum Interest Cover Default Spread
BBB 2.39 0.5%
BBB- 2.04 1.0%

Selected Financial Data about the Company:

  • Estimated EBIT: ₦2,200,000
  • Current Interest Expenses: ₦800,000

Required:

a.
i. Determine the value of the convertible bond offer. (5 Marks)
ii. Discuss why the convertible bond cannot generally be considered as “cheap debt” despite its low coupon, given its financing advantage quantified in economic terms. (3 Marks)

b.
i. Compute the company’s current interest coverage ratio. (1 Mark)
ii. How much money should be raised with the convertible bond issue (in thousands of naira) to avoid the threat of a rating downgrade, based on the quoted rating guidelines? (4 Marks)

c. Advise the company on the advantages of convertible bonds for companies on one hand and for investors on the other hand. (7 Marks)

Login or create a free account to see answers

Find Related Questions by Tags, levels, etc.

Report an error

You're reporting an error for "FM – May 2017 – L3 – Q4 – Financing Decisions and Capital Markets"

CR – Nov 2014 – L3 – SB – Q3 – Presentation of Financial Statements (IAS 1)

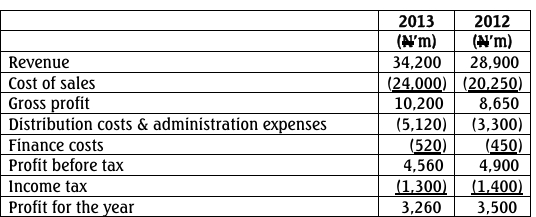
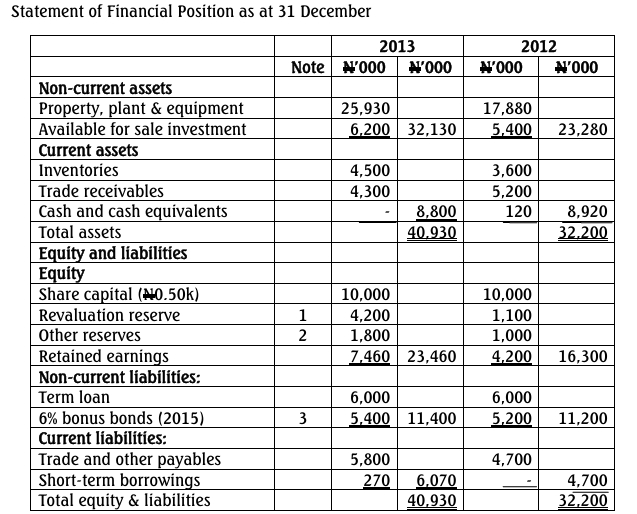
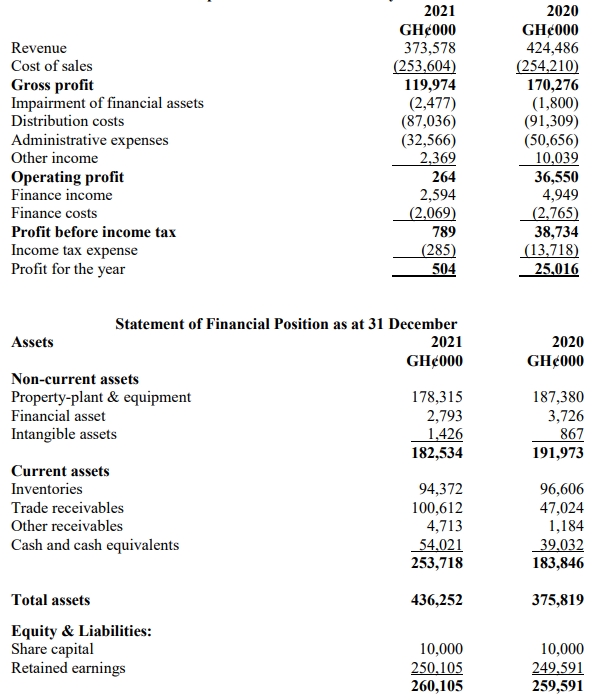
Analyze Prochain Plc’s financial performance and calculate key ratios for loan covenants.

Prochain Plc

The Directors of Prochain Plc have pursued an aggressive policy of expansion in the last two years. They have developed several new products and market share has increased.

The financial statements for the year ended 31 December 2013, which will be presented to the Board of Directors at its next meeting, are being finalised. The financial statements at the year-end are presented below:

Statement of profit or loss and other comprehensive income for the year ended 31 December

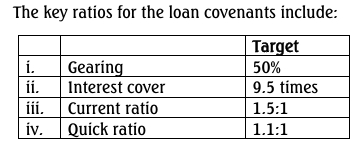
The results of the company as well as certain key ratios that will form part of the covenants in respect of the loan facilities will be discussed at the Board of Directors meeting.

Notes:

  1. The movement on the revaluation reserve relates to property, plant, and equipment revalued in the year.
  2. The movement on other reserves relates to the gains on the investments available for sale.
  3. The bonds are repayable on 1 July 2015.

Required:

(a) Based on the results of Prochain Plc for the year ended 31 December 2013, calculate the key ratios for the loan.
(8 Marks)

(b) Prepare a report commenting on the financial performance for the year in relation to the key ratios for the loan.
(12 Marks)

(Total 20 Marks)

Login or create a free account to see answers

Find Related Questions by Tags, levels, etc.

Report an error

You're reporting an error for "CR – Nov 2014 – L3 – SB – Q3 – Presentation of Financial Statements (IAS 1)"

FM – Nov 2016 – L3 – Q6 – Strategic Performance Measurement

Evaluate Osamco Limited's financial performance and discuss reasons for its potential stock exchange listing.

Osamco Limited, a manufacturer of wire and cables, was bought from its conglomerate parent company in a management buyout deal in August 2010. Six years later, the managers are considering the possibility of listing the company’s shares on the Nigerian Stock Exchange.

The following financial information is made available:

OSAMCO LIMITED
Income Statement for the Year Ended June 30, 2016

Item Amount (N’million)
Turnover 91.25
Cost of sales (79.00)
Profit before interest and taxation 12.25
Interest (3.25)
Profit before taxation 9.00
Taxation (1.25)
Profit attributable to ordinary shareholders 7.75
Dividend (0.75)
Retained profit 7.00

Statement of Financial Position as at June 30, 2016

Average performance ratios for the industry sector in which Osamco Limited operates are as stated below:

Industry Sector Ratios

Ratio Industry Average
Return before interest and tax on long-term capital employed 24%
Return after tax on equity 16%
Operating profit as a percentage of sales 11%
Current ratio 1.6:1
Quick (acid test) ratio 1.0:1
Total debt: equity (gearing) 24%
Dividend cover 4.0
Interest cover 4.5

Required:

  1. (a) Evaluate the financial state and performance of Osamco Limited by comparing it with that of its industry sector. (10 Marks)
  2. (b) Discuss four probable reasons why the management of Osamco Limited is considering Stock Exchange listing. (5 Marks)

Login or create a free account to see answers

Find Related Questions by Tags, levels, etc.

Report an error

You're reporting an error for "FM – Nov 2016 – L3 – Q6 – Strategic Performance Measurement"

CR – Nov 2021 – L3 – Q2b – Earnings Per Share (IAS 33)

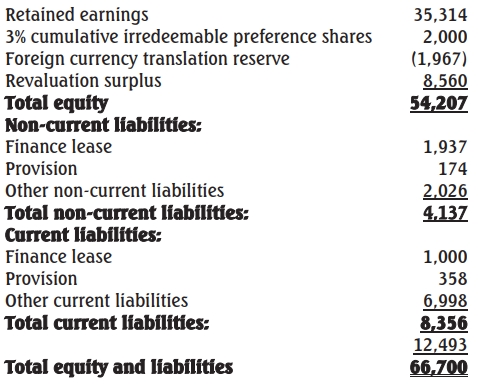
Calculate basic and diluted earnings per share (EPS) from Nsukka Plc’s consolidated financial statements.

b. The following financial information relates to Nsukka Group for the year ended June 30, 2021.

Nsukka Group Consolidated Statement of Financial Position as at June 30, 2021

Additional Information:

  1. Nsukka PLC reports a profit after tax, after adjusting for all current year accounting issues, of N1,850,000 and an effective tax rate of 20%.
  2. For the first time, Nsukka PLC issued 1,000,000 ordinary shares and granted options for 400,000 shares on July 1, 2020. The exercise price was the market price of N1.50 per share at the grant date. Options vest on July 1, 2020, and expire on June 30, 2022. The average market price of shares in Nsukka Plc during the year ended June 30, 2022, was N1.834.
  3. A rights issue of 1 for every 20 shares was made on May 31, 2021, at a price of N1.30 per share. The market price at this date was N1.60, and the average price for the year to June 30, 2021, was N1.65.
  4. Nsukka PLC has N1,000,000 of 6% convertible loans included in other non-current liabilities. These were in issue throughout the year and may be converted into 100,000 ordinary shares. No loans were converted during the year. There are no dividends in arrears on the 3% preference shares.

Required:

Evaluate basic and diluted earnings per share from the consolidated statement of financial position as at June 30, 2021, for Nsukka Plc.
(12 Marks)

Login or create a free account to see answers

Find Related Questions by Tags, levels, etc.

Report an error

You're reporting an error for "CR – Nov 2021 – L3 – Q2b – Earnings Per Share (IAS 33)"

CR – May 2018 – L3 – SB – Q2 – Associates and Joint Ventures (IAS 28

Calculate and interpret key financial ratios for Wole-Adura Group and evaluate liquidity.

Set out below are the draft accounts of Wole-Adura Plc and subsidiaries and of Maseru Associates. Wole-Adura acquired 40% of the equity capital of Maseru Associates three years ago when the latter’s retained earnings stood at N140m.

Abridged statement of financial position

Wole-Adura Plc & Subsidiaries Maseru Associates
Property, plant, and equipment 990 Nm
Investment in Maseru Associates at cost 290 Nm
Loan to Maseru Associates 70 Nm
Current assets 450 Nm
Loan from Wole-Adura Plc.
Total Assets 1800 Nm

FINANCED BY:

| Ordinary shares of 50k each | 1,125 Nm | 350 Nm | | Retained earnings | 675 Nm | 350 Nm | | Total Equity | 1800 Nm | 700 Nm |

Abridged statements of profit or loss

Wole-Adura Plc & Subsidiaries Maseru Associates
Profit before tax 427.50 Nm
Tax expense (157.50 Nm)
Profit after tax 270.00 Nm

Additional information:

(i) Wole-Adura proposed a dividend of N225m.
(ii) Total market capitalisation is N5,625m.


Required:

(a) Calculate each of these ratios for Wole-Adura Plc. and subsidiaries:

  1. Earnings per share
  2. Dividend cover
  3. Earnings yield
  4. Dividend yield

(4 Marks)

(b)

  1. Using the equity method, compute the earnings of the group incorporating the associates. (4 Marks)
  2. Compute the ratios in (a) above for the group. (4 Marks)

(c) Comment on the ratios calculated in (a) and (b) above by pairwise comparison. (3 Marks)

(d) Extracts from the financial statements of Ikoku Plc. recently published are as follows:

Statement of profit or loss for the year ended December 31, 2017

2017 2016
Revenue 360 Nm
Cost of sales (150 Nm)
Gross profit 210 Nm
Operating expenses (50 Nm)
Operating profit 160 Nm
Interest expense (10 Nm)
Tax expense (60 Nm)
Profit for the year 90 Nm

Statement of financial position as at December 31, 2017

2017 2016
Non-current assets
Property, plant & equipment 80 Nm
Current assets
Inventory 200 Nm
Trade receivables 70 Nm
Bank (50 Nm)
Total assets 300 Nm

Equity & liabilities

| Ordinary shares of N1 each | 60 Nm | 40 Nm | | Current liabilities | | | Trade payables | 190 Nm | 60 Nm | | Current tax | 50 Nm | 15 Nm | | Total liabilities and equity | 300 Nm | 115 Nm |

Required:

Discuss the liquidity challenges of Ikoku Plc. during the year ended December 31, 2017, from the extracts of the published financial statements. (5 Marks)

(Total 20 Marks)

Login or create a free account to see answers

Find Related Questions by Tags, levels, etc.

Report an error

You're reporting an error for "CR – May 2018 – L3 – SB – Q2 – Associates and Joint Ventures (IAS 28"

CR – Nov 2018 – L3 – SB – Q3 – Business Combinations (IFRS 3)

Evaluation of Abana and Doha as potential acquisition targets using adjusted financial ratios.

Banny Plc. (Banny) is a diversified company that has achieved its present size through vertical and horizontal acquisition. The directors have identified two potential target entities for acquisition. The first is Abana Limited (Abana), which operates a cement business near Offa, Kwara State. The second is Doha Limited (Doha), also in the cement industry, located near Oturukpo, Benue State. Banny has obtained copies of their audited financial statements, along with additional information notes.

Statement of Profit or Loss for the Year Ended December 31, 2017

Item Abana (₦’m) Doha (₦’m)
Revenue 136,000 132,000
Cost of sales (84,000) (91,900)
Gross profit 52,000 40,100
Other operating expenses (36,000) (28,000)
Profit from operations 16,000 12,100
Finance costs (6,000) (8,000)
Profit before tax 10,000 4,100
Income tax expense (3,000) (2,000)
Net profit for the period 7,000 2,100

Statement of changes in equity for the year ended December 31, 2017

Statement of financial position as at December 31, 2017

Additional Notes:

  1. Doha revalued its non-current assets for the first time following IFRS adoption on January 1, 2017. Abana maintains its non-current assets at historical cost.
  2. Banny uses the following ratios to evaluate acquisition targets: Return on Capital Employed (ROCE), Gross Profit Margin, Turnover on Capital Employed, and Leverage.

Required:

a. Compute adjustments for the revaluation of property, plant, and equipment, making Abana and Doha comparable for analysis. (14 Marks)

b. Calculate the four ratios (ROCE, Gross Profit Margin, Turnover on Capital Employed, and Leverage) after adjustments. (4 Marks)

c. Advise Banny on the better acquisition target based on adjusted ratios. (2 Marks)

Login or create a free account to see answers

Find Related Questions by Tags, levels, etc.

Report an error

You're reporting an error for "CR – Nov 2018 – L3 – SB – Q3 – Business Combinations (IFRS 3)"

CR – Nov 2023 – L3 – SB – Q2 – Consolidated Financial Statements (IFRS 10)

Analyze the profitability, cash flow, and investor ratios of Mama-Kitchen PLC and discuss dividend policy and EPS limitations.

Mama-Kitchen PLC owns a number of subsidiaries that operate standard fast-food eateries in all the six geopolitical zones of the country. You are the financial analyst of your Bank (Pam-Pam Bank Nigeria Limited) which owns 10% of the issued share capital of Mama-Kitchen PLC.

You are provided with the following financial and background information on Mama-Kitchen PLC.

Mama-Kitchen PLC

Consolidated statement of profit or loss for the year ended September 30

2023 2022
Revenue 188,900 145,850
Cost of sales (141,700) (110,400)
Gross profit 47,200 35,450
Admin expenses (31,200) (22,400)
Profit from operations 16,000 13,050
Finance cost (2,050) (2,100)
Profit before taxation 13,950 10,950
Income tax expense (3,050) (2,300)
Profit for the year 10,900 8,650
Earnings per share – basic 26.8k 21.3k
Earnings per share – diluted 21.2k 19.2k

Mama-Kitchen PLC

Consolidated statement of cash flows for the year ended September 30

2023 2022
Cash flows from operating activities:
Profit before taxation 13,950 10,950
Finance cost 2,050 2,100
Depreciation and amortisation 15,300 11,050
Loss on disposal of PPE 150 50
(Increase)/decrease in inventories (200) 50
Increase/decrease in receivables (1,250) (100)
Increase in trade payables 2,250 650
Total 32,250 24,750
Interest paid (2,050) (2,200)
Tax paid (1,600) (1,300)
Net cash flows from operating activities 28,600 21,250
Cash flows from investing activities:
Purchase of PPE (29,850) (28,950)
Proceed from sale of PPE 100 150
Net cash used in investing activities (29,750) (28,800)
Cash flows from financing activities:
Proceeds from issues of shares 1,200 100
Borrowings 3,250 10,000
Net cash flow from financing activities 4,450 10,100
Net increase in cash and cash equivalents 3,300 2,550
Cash and cash equivalents at beginning 12,400 9,850
Cash and cash equivalents at year end 15,700 12,400

Details of revenue, fast food outlets profits, and new fast food outlets openings for the year ended September 30

2023 2022
Revenue per fast food outlets:
At September 30 1,770 1,715
Opened in the current financial year 1,290
Gross profit per outlet opened
At September 30 435 415
In the current financial year 345

Note:

  • 30 new outlets were opened during the year ended September 30, 2023, bringing the total to 115 fast food outlets.

Additional financial information

2023 2022
Gross profit margin 25% 24.3%
Debt equity ratio 35.2% 44.4%
Current ratio 0.56:1 0.48:1
Trade payables payment period 86 days 103 days
Return on capital employed 20% 19.1%
Cash return on capital employed 40.2% 36.3%
Earnings before Interest, tax, depreciation and amortisation (N‟m) 31,300 24,100
Non-current assets turnover 1.68 times 1.49 times
Share price (at September 30) 302k 290k

Background information

i. Mama-Kitchen PLC has a reputation of depreciating its assets more slowly than others in the industry.

ii. The strategy of the group is to fund new fast food outlets capital expenditure from existing operating cash flows without needing to raise new borrowings.

iii. Revenue growth in the industry is estimated at 4.1% per annum.

iv. It is the company’s policy to increase promotional and advertising spending on new outlets to encourage strong initial sales.

v. The board has accused the management of concentrating on new outlet openings to the detriment of existing outlets.

vi. One of your colleagues, a financial analyst, stated that the company has not been able to pay dividends because of the debit balance on its consolidated retained earnings.

Required:

a. Draft a report addressed to the Managing Director of Pam-Pam Bank Limited analyzing the profitability, cash flows, and investor ratios of Mama-Kitchen PLC. You should also identify and justify matters that you consider will require further investigations.
(13 Marks)

b. Explain the validity or otherwise of your colleague financial analyst’s statement that Mama-Kitchen PLC was unable to pay dividends because of the debit balance on consolidated retained earnings.
(4 Marks)

c. Explain the usefulness and limitations of diluted earnings per share information to investors.
(3 Marks)

Login or create a free account to see answers

Find Related Questions by Tags, levels, etc.

Report an error

You're reporting an error for "CR – Nov 2023 – L3 – SB – Q2 – Consolidated Financial Statements (IFRS 10)"

FR – Nov 2023 – L2 – Q4c – Financial Statement Analysis

State two limitations of using financial ratios for company performance analysis.

State TWO (2) limitations of ratios.

Login or create a free account to see answers

Find Related Questions by Tags, levels, etc.

Report an error

You're reporting an error for "FR – Nov 2023 – L2 – Q4c – Financial Statement Analysis"

FR – July 2023 – L2 – Q4 – Performance Analysis

Assess the financial performance of Besease Ltd using financial ratios and prepare a report for the board of directors.

Besease Ltd won two prestigious awards in 2020 despite the negative impact of the COVID-19 pandemic. The Board of Directors seeks to assess the company’s performance for the year ended 31 December 2021 in comparison to 2020.

Below are the financial statements for the year ended 31 December 2021:

Statement of comprehensive income for the year ended 31 December

2021 (GH¢) 2020 (GH¢)
Revenue 7,315,927 6,184,754
Cost of sales (4,322,986) (3,441,339)
Gross profit 2,992,941 2,743,415
Other income 330,812 280,832
Administrative expenses (2,511,179) (2,648,987)
Operating profit 812,574 375,260
Finance cost (496,913) (174,872)
Profit before tax 315,661 200,388
Taxation (188,621) (30,700)
Profit for the year 127,040 169,688

Statement of financial position as at 31 December

2021 (GH¢) 2020 (GH¢)
Non-current assets
Property, Plant & Equipment 9,224,988 5,102,799
Intangible assets 35,824 33,350
Investments 36,629 36,629
Total non-current assets 9,297,441 5,172,778
Current assets
Inventories 2,878,337 1,329,279
Trade receivables 1,875,594 2,246,747
Cash and bank balances 527,412 372,081
Total current assets 5,281,343 3,948,107
Total assets 14,578,784 9,120,885
Equity & Liabilities
Equity
Share capital 217,467 217,467
Retained earnings 1,289,140 1,162,100
Credit reserve 826,528 1,102,037
Total equity 2,333,135 2,481,604
Non-current liabilities
Interest-bearing loans 6,708,598 2,800,223
Deferred taxation 187,624 186,304
Total non-current liabilities 6,896,222 2,986,527
Current liabilities
Trade payables 1,257,693 1,550,466
Taxation 118,337 101,391
Other payables 2,993,667 1,021,167
Accrued expenses 979,730 979,730
Total current liabilities 5,349,427 3,652,754
Total equity & liabilities 14,578,784 9,120,885

The Finance Manager has selected the following performance ratios:
i) Return on capital employed (capital employed = interest-bearing debt + shareholders’ equity) (%)
ii) Return on equity (%)
iii) Acid test ratio (times)
iv) Debt-to-equity ratio
v) Interest cover ratio (times)

Required:
Write a report to the Board of Directors assessing the comparative performance of Besease Ltd for the year ended 31 December 2021 using the given ratios.

Login or create a free account to see answers

Find Related Questions by Tags, levels, etc.

Report an error

You're reporting an error for "FR – July 2023 – L2 – Q4 – Performance Analysis"

FR – Nov 2021 – L2 – Q4 -Financial Statement Analysis

Analysis of financial ratios and performance of Bebebe Ltd for 2019 and 2020.

The following are the accounts of Bebebe Ltd (Bebebe), a company that manufactures playground equipment for the year ended 30 November 2020.

Statement of Comprehensive Income for the year ended 30 November:

Required:

a) Calculate, for both years, the return on equity and the return on capital employed. (4 marks)

b) Calculate, for both years, TWO (2) investment ratios to a potential investor. (4 marks)

c) Calculate, for both years, TWO (2) ratios of interest to a potential long-term lender. (4 marks)

d) Comment on the performance of Bebebe to a potential shareholder and lender using the ratios calculated above. (5 marks)

e) Explain THREE (3) weaknesses in these ratios.

(3 marks)

Login or create a free account to see answers

Find Related Questions by Tags, levels, etc.

Report an error

You're reporting an error for "FR – Nov 2021 – L2 – Q4 -Financial Statement Analysis"

FR – May 2016 – L2 – Q4 – Financial Statement Analysis

Prepare a report for the managing director of ANN Co. on IB Co's financial position, focusing on gearing and liquidity ratios.

ANN Co is considering acquiring an interest in its competitor IB Co Ltd. The managing director of ANN Co has obtained the three most recent statements of financial position of IB Co Ltd as shown below:

IB Co Ltd – Statement of Financial Position as at 31st December:

2013 2014 2015
Non-current assets
Land and buildings 11,460 12,121 11,081
Plant and equipment 8,896 9,020 9,130
Total non-current assets 20,356 21,141 20,211
Current assets
Inventories 1,775 2,663 3,995
Trade receivables 1,440 2,260 3,164
Cash 50 53 55
Total current assets 3,265 4,976 7,214
Total assets 23,621 26,117 27,425
Equity
Share capital 8,000 8,000 8,000
Retained earnings 6,434 7,313 7,584
Total equity 14,434 15,313 15,584
Non-current liabilities
12% debentures (2015-2018) 5,000 5,000 5,000
Current liabilities
Trade payables 390 388 446
Bank 1,300 2,300 3,400
Income taxes payable 897 1,420 1,195
Dividend payable 1,600 1,696 1,800
Total current liabilities 4,187 5,804 6,841
Total equity and liabilities 23,621 26,117 27,425

Required:
Prepare a report for the managing director of ANN Co, commenting on the financial position of IB Co Ltd and highlighting any areas that require further investigation (using gearing and liquidity ratios only).

Login or create a free account to see answers

Find Related Questions by Tags, levels, etc.

Report an error

You're reporting an error for "FR – May 2016 – L2 – Q4 – Financial Statement Analysis"

CR – May 2019 – L3 – Q4 – Analysis and interpretation of financial statements

The question requires calculation of financial ratios and analysis of the financial performance and cash position of Madina Ltd for the year ended 30 September 2018.

Below are the recently issued financial statements of Madina Ltd, a listed company, for the year ended 30 September 2018, together with comparatives for 2017.

Statement of Profit or Loss for the year ended 30 September:

Details 2018 (GH¢’000) 2017 (GH¢’000)
Revenue 125,000 90,000
Cost of Sales (100,000) (75,000)
Gross Profit 25,000 15,000
Operating Expenses (13,000) (11,000)
Finance Costs (4,000)
Profit before Tax 8,000 4,000
Tax (at 25%) (2,000) (1,000)
Profit for the year 6,000 3,000

Statement of Financial Position as at 30 September:

Details 2018 (GH¢’000) 2017 (GH¢’000)
Non-Current Assets
Property, Plant, and Equipment 105,000 45,000
Goodwill 5,000
Total Non-Current Assets 110,000 45,000
Current Assets
Inventory 12,500 7,500
Receivables 6,500 4,000
Bank 7,000
Total Current Assets 19,000 18,500
Total Assets 129,000 63,500
Equity and Liabilities
Equity
Share Capital 50,000 50,000
Retained Earnings 7,000 6,000
Total Equity 57,000 56,000
Non-Current Liabilities
8% Loan Notes 50,000
Current Liabilities
Bank Overdraft 8,500
Trade Payables 11,500 6,500
Current Tax Payable 2,000 1,000
Total Current Liabilities 22,000 7,500
Total Equity and Liabilities 129,000 63,500

Additional Information:

  • On 1 October 2017, Madina Ltd acquired 100% of the net assets of Aboabu Ltd for GH¢50 million. In order to finance this transaction, Madina Ltd issued GH¢50 million 8% loan notes on the acquisition date.
    Aboabu Ltd’s results for the year ended 30 September 2018 are shown below:

Aboabu Ltd’s Statement of Profit or Loss for the year ended 30 September:

Details GH¢’000
Revenue 35,000
Cost of Sales (20,000)
Gross Profit 15,000
Operating Expenses (4,000)
Profit before Tax 11,000
Tax (at 25%) (2,750)
Profit for the year 8,250
  • Aboabu Ltd has not paid any dividend during the year, but Madina Ltd paid a dividend of GH¢0.05 per share.
  • The following ratios have been calculated for Madina Ltd for the year ended 30 September 2017:
    • Return on capital employed: 7.1%
    • Gross profit margin: 16.7%
    • Net profit (before tax) margin: 4.4%

Required:

a) Calculate the equivalent ratios for Madina Ltd for 2018:
i) Including the results of Aboabu Ltd acquired during the year. (3 marks)
ii) Excluding all effects of the purchase of Aboabu Ltd. (3 marks)

b) Analyse the performance of Madina Ltd for the year ended 30 September 2018. (5 marks)

c) Analyse the cash position of Madina Ltd as at 30 September 2018. (4 marks)

Login or create a free account to see answers

Find Related Questions by Tags, levels, etc.

Report an error

You're reporting an error for "CR – May 2019 – L3 – Q4 – Analysis and interpretation of financial statements"

CR – Nov 2018 – L3 – Q4 – Consolidated Financial Statements

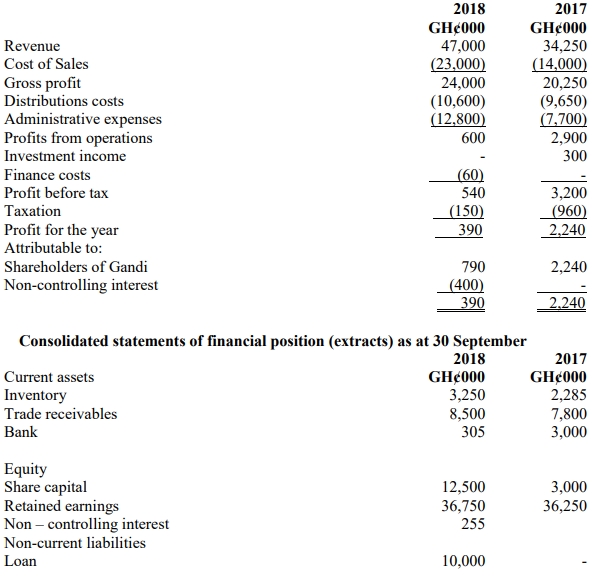
Calculate key financial ratios for TGG and analyze its financial performance and cash flow based on the data provided for the year ended 30 September 2018.

The Gandi Group (TGG) operates in the farming industry and has operated a number of 100% owned subsidiaries for many years. The Gandi group has its operations in the Brong-Ahafo Region of Ghana. Its financial statements for the last two years are shown below.

Additional Information:

  1. TGG has become increasingly worried about two major areas in its business environment: reliance on large supermarkets (which demand long payment terms), and the increase in fuel prices, which raises the cost of distribution.
  2. To address these concerns, TGG purchased 80% of Asida Ltd on 1 October 2017. This was TGG’s first acquisition of a subsidiary without owning 100% of it. Asida Ltd operates two luxury hotels in the Ashanti Region.
  3. TGG raised finance by disposing of GH¢5.5 million in investments (with a GH¢2.25 million gain on disposal, included in administrative expenses) and by taking a GH¢10 million loan.
  4. Asida Ltd opened a third hotel in Accra in March 2018. Initial reviews were poor, but feedback improved after the appointment of a new marketing director in May 2018.
  5. Ratios for the year ended 30 September 2017:
    • Gross profit margin: 59.1%
    • Operating margin: 8.5%
    • Return on capital employed: 7.4%
    • Inventory turnover period: 60 days
    • Receivables collection period: 83 days

Required: a) Prepare the equivalent ratios for the year ended 30 September 2018.
(5 marks)

b) Analyze the financial performance and cash flow of TGG for the year ended 30 September 2018, making specific reference to any concerns or expectations regarding future periods.
(10 marks)

Login or create a free account to see answers

Find Related Questions by Tags, levels, etc.

Report an error

You're reporting an error for "CR – Nov 2018 – L3 – Q4 – Consolidated Financial Statements"

CR – Aug 2022 – L3 – Q5 – Analysis and interpretation of financial statements

This question requires writing a report that assesses the comparative performance of a company using various financial ratios (profitability, liquidity, efficiency, and gearing).

Wadie Ltd has been in operation for the past ten years. The company started operations in Kumasi with just three employees, but currently operates in all regions of Ghana, with over five hundred employees.

The final meeting for the year of the Board of Directors of the company is to be convened, and as a tradition, the Finance Manager presented an analysis of the financial performance of the company for the financial year ended 31 December 2021. Below are the financial statements for the year ended 31 December 2021:

Statement of Comprehensive Income for the year 31 December

Additional Information:

i) Finance income relates to interest earned on the company’s investment in Government of Ghana loan notes.

ii) Dividend payable represents the dividend declared or approved by shareholders at the last Annual General Meeting.

Required:

As the Finance Manager of the company, write a report to the Board of Directors, assessing the comparative performance of the company for the year ended 31 December 2021. Your report should use THREE (3) profitability ratios, TWO (2) liquidity ratios, THREE (3) efficiency ratios, and TWO (2) gearing ratios.


Login or create a free account to see answers

Find Related Questions by Tags, levels, etc.

Report an error

You're reporting an error for "CR – Aug 2022 – L3 – Q5 – Analysis and interpretation of financial statements"

CR – Nov 2019 – L3 – Q5 – Analysis and Interpretation of Financial Statements

Analyze the financial performance of Pep Ltd over the past three years and recommend areas for further investigation.

You are the Financial Controller of Oxtom Ltd. Pep Ltd is a competitor in the same industry and has been operating for 20 years. Summaries of Pep Ltd’s Statements of Profit or Loss and Financial Position for the previous three years are given below:

Pep Ltd – Summarised Statement of Profit or Loss for the year ended 31 December

Item 2016 (GH¢’m) 2017 (GH¢’m) 2018 (GH¢’m)
Revenue 840 981 913
Cost of sales (554) (645) (590)
Gross profit 286 336 323
Selling, distribution, and admin expenses (186) (214) (219)
Profit before interest and taxes 100 122 104
Finance cost (6) (15) (19)
Profit before taxation 94 107 85
Taxation (45) (52) (45)
Profit after taxation 49 55 40
Dividends 24 24 24

Pep Ltd – Summarised Statement of Financial Position as at 31 December

Item 2016 (GH¢’m) 2017 (GH¢’m) 2018 (GH¢’m)
Assets
Non-current assets
Intangible assets 36 40 48
Tangible assets (net) 176 206 216
Total non-current assets 212 246 264
Current assets
Inventories 237 303 294
Receivables 105 141 160
Bank 52 58 52
Total current assets 394 502 506
Total assets 606 748 770
Equity and Liabilities 2016 (GH¢’m) 2017 (GH¢’m) 2018 (GH¢’m)
Equity
Stated capital 100 100 100
Retained earnings 299 330 346
Total equity 399 430 446
Non-current liabilities
Long-term loans 74 138 138
Current liabilities
Trade payables 53 75 75
Other payables 80 105 111
Total equity and liabilities 606 748 770

Required:
a) Write a report to the Chief Executive Officer of Oxtom Ltd analyzing the performance of Pep Ltd, showing any calculations in an appendix to the report. (14 marks)
b) Summarize THREE (3) areas which require further investigation, including reference to other pieces of information that would complement your analysis of Pep Ltd’s performance. (6 marks)

Login or create a free account to see answers

Find Related Questions by Tags, levels, etc.

Report an error

You're reporting an error for "CR – Nov 2019 – L3 – Q5 – Analysis and Interpretation of Financial Statements"

CR – Mar 2023 – L3 – Q5 – Analysis and interpretation of financial statements Series

Compute financial ratios including operating profit margin, ROCE, inventory turnover, current ratio, capital gearing, and dividend yield for Atiku Ltd and Obi Ltd.

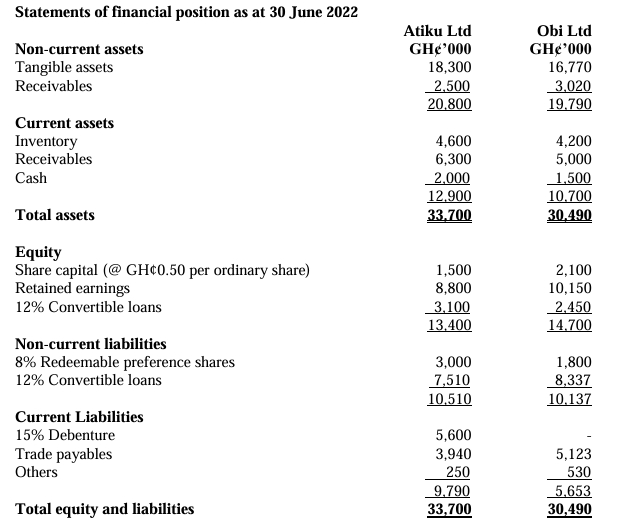
Atiku Ltd operates in the same business sector as Obi Ltd. The directors of Atiku Ltd would like to understand the firm’s strengths and weaknesses relative to Obi Ltd from the latest financial statements of the two entities as set out below:

Summarised Statements of Profit or Loss for the year ended 30 June 2022:


Net profit figures were arrived at after considering the following items:

  • Depreciation and amortisation: Atiku Ltd (GH¢3,110), Obi Ltd (GH¢2,850)
  • Employee benefits: Atiku Ltd (GH¢7,200), Obi Ltd (GH¢6,050)
  • Finance cost: Atiku Ltd (GH¢1,050), Obi Ltd (GH¢880)
  • Provision for current tax: Atiku Ltd (GH¢1,004), Obi Ltd (GH¢925)
  • Deferred tax decrease in provision: Atiku Ltd (GH¢116), Obi Ltd (GH¢55)
  • Current tax under-provision (2021): Atiku Ltd (nil), Obi Ltd (GH¢32)

Additional information: The following ratios have been extracted from the Directors’ Report accompanying the financial statements:

  • Gross profit margin: Atiku Ltd (22%), Obi Ltd (25%)
  • Dividend coverage: Atiku Ltd (4), Obi Ltd (5)
  • Current share price: Atiku Ltd (GH¢2.10), Obi Ltd (GH¢1.55)

Required:
a) Compute the following ratios for both entities for the year ended 30 June 2022: i) Operating profit margin (1.5 marks)
ii) Return on capital employed (capital employed defined as all interest-bearing liabilities and equity) (1.5 marks)
iii) Inventory turnover period (1.5 marks)
iv) Current ratio (1.5 marks)
v) Capital (long-term) gearing (1.5 marks)
vi) Dividend yield (2.5 marks)

b) Write a report to the Chief Executive Officer analyzing Atiku Ltd’s financial performance and position relative to Obi Ltd, for the year ended 30 June 2022. For the report writing, use only the following ratios: operating profit margin, return on capital employed, capital gearing and dividend yield. (10 marks)


Login or create a free account to see answers

Find Related Questions by Tags, levels, etc.

Report an error

You're reporting an error for "CR – Mar 2023 – L3 – Q5 – Analysis and interpretation of financial statements Series"

CR – Dec 2022 – L3 – Q5 – Analysis and Interpretation of Financial Statements

Evaluate Partey Ltd's performance using key financial ratios for profitability, liquidity, efficiency, and gearing.

Partey Ltd is a company engaged in continuous casting and cold rolling of aluminum products in Ghana. The company has been in operation for several decades, and its operations did not change in the year ended 31 December 2021.

Below are financial statements for the years 2021 and 2020:

Statement of Profit or Loss and Other Comprehensive Income

2021 (GH¢000) 2020 (GH¢000)
Revenue 389,507 445,963
Cost of sales (240,731) (237,345)
Gross profit 148,776 208,618
Other income 19,315 10,983
Distribution costs (76,366) (108,137)
Administrative expenses (74,520) (46,216)
Operating profit 17,205 65,248
Finance cost (21,287) (21,537)
Profit before tax (4,082) 43,711
Tax expense (16,521)
Profit for the year (4,082) 27,190

Statement of Financial Position

2021 (GH¢000) 2020 (GH¢000)
Non-current assets:
Property, plant and equipment 196,784 183,190
Investment securities 137 348
Total non-current assets 196,921 183,538
Current assets:
Inventories 50,400 66,351
Trade receivables 23,769 27,688
Other receivables 9,343 1,833
Cash and cash equivalents 45,969 20,699
Total current assets 129,481 116,571
Total assets 326,402 300,109
Equity and Liabilities:
Stated capital 10,000 10,000
Retained earnings 124,575 111,676
Total equity 134,575 121,676
Non-current liabilities:
15% Loan notes 8,580 10,247
20% Loan notes (NGIC Pension Fund) 100,000 100,000
Total non-current liabilities 108,580 110,247
Current liabilities:
Trade payables 80,182 65,082
Current tax 3,104
Accrued expenses 3,065
Total current liabilities 83,247 68,186
Total equity and liabilities 326,402 300,109

Required:

a) As the Finance Manager of Partey Ltd, you have been tasked by the Board of Directors to produce a report. Assess the performance of the company over time based on profitability, liquidity, efficiency, and gearing.
(Note: Your report should include TWO (2) ratios each of profitability, liquidity, efficiency, and gearing).
(16 marks)

b) Management of the company wants to achieve improvement in technology and production processes to stimulate growth. However, this will require further injection of funds and less strain on operating cash flows. To achieve this, the Board of Directors of the company has resolved to convince the company’s largest debtholder, NGIC Pension Fund, to exercise the conversion right attached to the debt. The total value of the debt included in the financial statements for both financial years is GH¢100 million. The debt was issued at a coupon rate of 20% per annum. The annual coupon payments are also included in the financial statements above for both financial years. NGIC Pension Fund is also the second-largest shareholder of the company.

The estimated tax expense on the company’s profit for the year ended 31 December 2021, if the debt owed to NGIC Pension Fund is converted, is GH¢3.172 million. Current tax liability at 31 December 2021 is expected to increase by the same amount.

Required:
Assess the performance of the company for the year ended 31 December 2021 upon conversion of the debt owed to NGIC Pension Fund on 1 January 2021 at its carrying amount.
(4 marks)

Login or create a free account to see answers

Find Related Questions by Tags, levels, etc.

Report an error

You're reporting an error for "CR – Dec 2022 – L3 – Q5 – Analysis and Interpretation of Financial Statements"

Oops!

This feature is only available in selected plans.

Click on the login button below to login if you’re already subscribed to a plan or click on the upgrade button below to upgrade your current plan.

If you’re not subscribed to a plan, click on the button below to choose a plan