- 10 Marks
Question
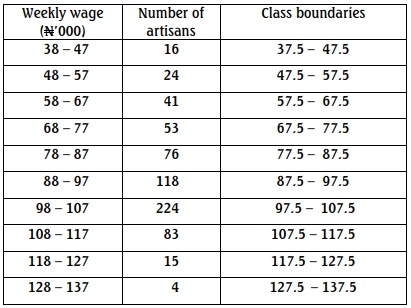
b. The table below shows the weekly wage distribution of artisans in a certain factory:
| Weekly Wage (₦’00) | Number of Artisans |
|---|---|
| 38 – 47 | 16 |
| 48 – 57 | 24 |
| 58 – 67 | 41 |
| 68 – 77 | 53 |
| 78 – 87 | 76 |
| 88 – 97 | 118 |
| 98 – 107 | 224 |
| 108 – 117 | 83 |
| 118 – 127 | 15 |
| 128 – 137 | 4 |
i. Draw a histogram to represent the wage distribution using the scales: On x-axis, let 1 cm represent ₦100; on y-axis, let 1 cm represent 10 artisans. (4 Marks)
ii. Deduce the modal weekly wage from the histogram. (2½ Marks)
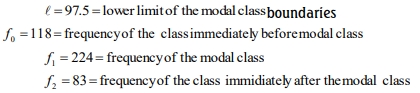
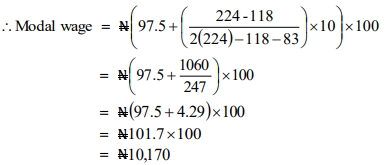
iii. Use the appropriate formula to calculate the modal weekly wage. (3½ Marks)
Answer

ii. – The histogram is drawn as shown.
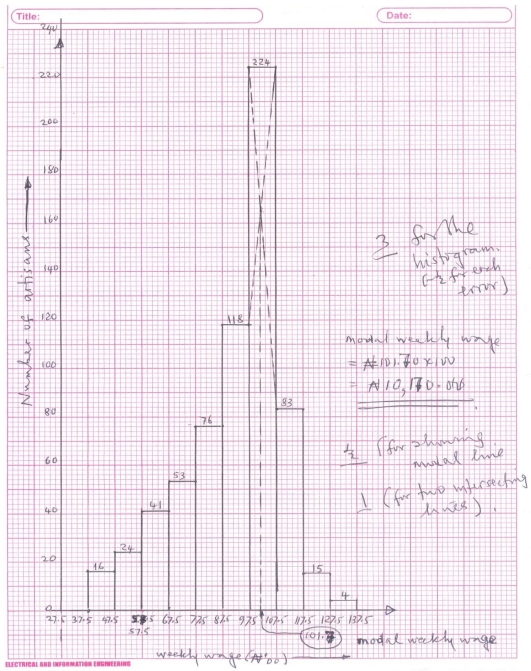
From the histogram, the modal wage = N10,170.00
iii. By calculation, the mode is given by
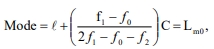
![]()
Where:


- Tags: Histogram, Modal Wage, Wage Distribution
- Level: Level 1
- Topic: Data Collection Analysis
- Series: MAY 2017
- Uploader: Kwame Aikins